. 2009 May;29(9):2359-71.
doi: 10.1128/MCB.01259-08. Epub 2009 Mar 2.

Polycystin-1 regulates extracellular signal-regulated kinase-dependent phosphorylation of tuberin to control cell size through mTOR and its downstream effectors S6K and 4EBP1

Affiliations

Polycystin-1 regulates extracellular signal-regulated kinase-dependent phosphorylation of tuberin to control cell size through mTOR and its downstream effectors S6K and 4EBP1

Gianfranco Distefano et al. Mol Cell Biol. 2009 May.

Abstract

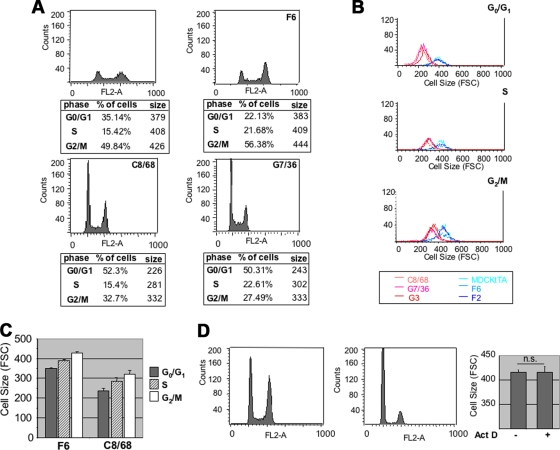
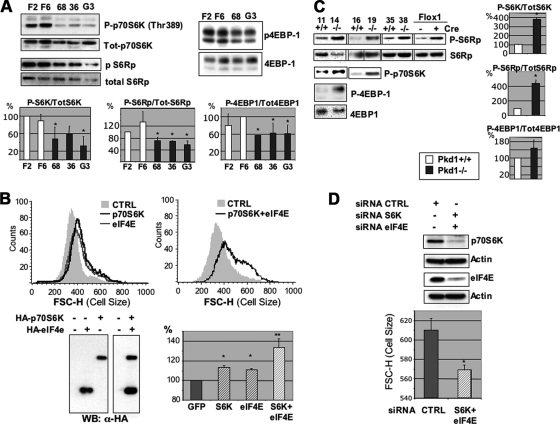
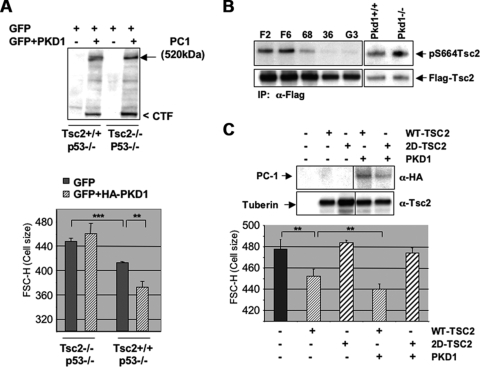
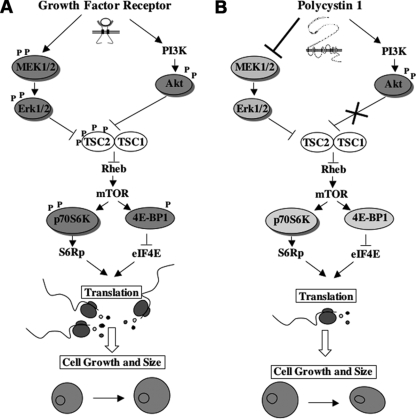
Autosomal dominant polycystic kidney disease (ADPKD) is a common genetic disease characterized by bilateral renal cyst formation. Both hyperproliferation and hypertrophy have been previously observed in ADPKD kidneys. Polycystin-1 (PC-1), a large orphan receptor encoded by the PKD1 gene and mutated in 85% of all cases, is able to inhibit proliferation and apoptosis. Here we show that overexpression of PC-1 in renal epithelial cells inhibits cell growth (size) in a cell cycle-independent manner due to the downregulation of mTOR, S6K1, and 4EBP1. Upregulation of the same pathway leads to increased cell size, as found in mouse embryonic fibroblasts derived from Pkd1-/- mice. We show that PC-1 controls the mTOR pathway in a Tsc2-dependent manner, by inhibiting the extracellular signal-regulated kinase (ERK)-mediated phosphorylation of tuberin in Ser664. We provide a detailed molecular mechanism by which PC-1 can inhibit the mTOR pathway and regulate cell size.


Figures

FIG. 1.
FIG. 1.
PC-1 overexpression induces reduced cell growth and size in MDCK cells. (A) (Top) Two MDCK Zeo controls (F6 and F2) and three independently derived MDCK PKD1 Zeo cell lines (G7/36 [36], C8/68 [68], and G3) were subject to Western blot analysis using an anti-PC-1 antibody. (Middle) Confluent monolayers of control MDCK Zeo (F6) and MDCK PKD1 Zeo cells (C8/68) were stained with an anti-E-cadherin antibody (green). The microphotographs were taken at equal magnifications (×40). (Bottom) The total content in μg of protein per μg of DNA was determined in three independently derived MDCK PKD1 Zeo cells (C8/68 [68], G7/36 [36], and G3) and three control cell lines (MDCKtTA [M], F6, and F2). (B) The same cell lines as in panel A were trypsinized and analyzed using a flow cytometer (FACS). Each spot represents a single cell, and the FSC-H values on the x axis represent the size measurements of the cells. SSC-H, side scattered light height (C) The same cell lines as in panel A were analyzed as in panel B and plotted on a single plot for comparison (red lines, MDCK PKD1 Zeo; blue lines, controls). (Bottom left) Histogram representation of the average FSC values of the six clones shown in the top plot, repeated in triplicate. Statistical analysis was performed by applying ANOVA (*, P < 0.0001). (Bottom right) Histogram representation of cell size after treatment with PDGF. (D) (Left) Western blot analysis of total lysates of MDCK cells transiently transfected with GFP alone (Ctrl) or in combination with a HA-PKD1 construct reveals the presence of both the full-length protein (arrow) and the C-terminal fragment (CTF) cleaved form (arrowhead). (Right) Quantification of the cell size (FSC-H) of transiently transfected MDCK cells was performed as described for panel B. Statistical analysis was performed by applying the Student's t test (*, P < 0.05). (E) The identical experiment as in panel D was repeated on NIH 3T3 cells. Statistical analysis was performed by applying the Student's t test (*, P < 0.05).
FIG. 2.
FIG. 2.
PC-1 regulation of cell size is cell cycle independent. (A) Cells were plated at 50% confluence and serum starved. After 24 h, they were fixed and stained using PI to determine their DNA content (on the x axis is fluorescence intensity). Cell size profiles were analyzed in each of the three phases of the cell cycle. The tables below the graphs show the percentages of cells in the G0/G1, S, and G2/M phases of the cell cycle and their mean FSC-H values, reflecting cell size (right column). (B) Single-plot representation of the distribution of sizes of cells in each of the three phases of the cell cycle. The difference in the FSC values was maintained in each phase, with much lower values in MDCK PKD1 Zeo clones (C8/68, G7/36, and G3) than in the negative controls (MDCKtTA, F6, and F2). (C) Histogram representation of the distribution of cell size in each phase of the cell cycle shows an increase in cell size. (D) Pkd1+/+ (no. 11 and 16) and Pkd1/ (no. 14 and 19) cells were treated as described for panel A, and cell size profiles were analyzed in the G0/G1 phase of the cell cycle. (Right) MDCK cells were treated overnight with vehicle only (left bar) or with 15 μM of actinomycin D (right bar; ActD). Upon treatment, cells are arrested in the G0/G1 phase of the cell cycle. Quantification of the cell size for cells in G0/G1 revealed no differences in size between untreated cells and those treated with actinomycin D. Statistical analysis was performed by applying the Student's t test. n.s., not statistically significant.
FIG. 3.
FIG. 3.
Cell cycle-independent increase in cell size in Pkd1/ MEFs. (A) (Top left) RT-PCR performed on RNA isolated from wt MEFs isolated at day E11.5. Total RNA incubated in the presence (RT+) or absence (RT−) of retrotranscriptase and subjected to PCR analysis revealed that the Pkd1 gene is expressed in these cells. (Bottom left) PCR analysis of the MEFs derived from a conditional mouse model (Pkd1flox/flox) treated in the presence (Cre+) or absence (Cre−) of a Cre recombinase (see Materials and Methods) shows that the last two exons have been successfully excised (ko) at a high rate. (Right) Statistical analysis of the differences in cell sizes between Pkd1+/+ and Pkd1/ MEFs either isolated as primary culture (no. 35 and 38) or immortalized (no. 11 and 14), as well as two independently derived MEFs generated from a conditional mouse model (Pkd1flox/flox) and treated in the presence (Cre+) or absence (Cre−) of Cre recombinase, revealed that, independently of the method employed, the absence of the Pkd1 gene always results in cells significantly larger than their counterpart controls. Statistical analysis was performed by applying ANOVA (**, P < 0.005; ***, P < 0.0001). The minor differences in size observed among the different Pkd1+/+ MEFs were not statistically significant. (B) Cells were plated at 50% confluence and serum starved, and after 24 h, they were fixed and stained using PI as described for Fig. 2. Top graphs show the analysis of the cell cycle, revealing that Pkd1/ has a higher proportion of cells in the G2/M phase of the cell cycle than do Pkd1+/+ MEFs. The tables below the graphs show the percentages of cells in G0/G1, S, and G2/M phases of the cell cycle and their mean FSC-H values (sizes, right column). The cell size profiles analyzed in each phase of the cell cycle revealed that the Pkd1/ cells are larger in size, independent of their cell cycle state. (C) Single plot representation of the distribution of cell sizes of the Pkd1+/+ (no. 11, light lines) and Pkd1/ (no. 14, dark lines) MEFs in each phase of the cell cycle, as analyzed in panel B. (D) Pkd1/ MEFs are larger in size, independent of the cell cycle phase in which they are analyzed. Statistical analysis was performed by applying ANOVA (*, P < 0.05; ***, P < 0.0001). (E) Transient transfection of full-length PC-1 into Pkd1/ MEFs (top Western blot) leads to a reduction in the distribution of cell size (middle plot) that is statistically significant (bottom histograms). Statistical analysis was performed by applying the Student's t test (*, P < 0.01).
FIG. 4.
FIG. 4.
PC-1 effects on cell growth and size are mediated by the mTOR/p70S6K pathway. (A) In total, two different MDCK Zeo (F2 and F6) and three different MDCK PKD1 Zeo (C8/68 [68], G7/36 [36], and G3) cells were plated at 50% density in 0.5% FCS. After 12 h, total lysates were analyzed using anti-phospho-Thr389-p70S6K, anti-phospho-S6Rp, or anti-4EBP1 protein. Blots were stripped and reprobed with antibodies against p70S6K, S6Rp, or tubulin, revealing the total amounts loaded in each lane. Quantification of the blots showed reduced phosphorylation of p70S6K, S6Rp, and 4EBP1 in MDCK PKD1 Zeo cells compared to the levels in controls (bottom histograms). Statistical analysis was performed by applying ANOVA (*, P < 0.05). (B) The C8/68 MDCK PKD1 Zeo cell line was transiently transfected with GFP along with either p70S6K alone (dark line), eIF4E alone (light line), or p70S6K and eIF4E in combination (dark line in the right-hand plot). The last condition completely restores cell size over the control GFP-transfected cells, while transfection of the single molecules alone had a smaller, though significant, effect. Statistical analysis was performed by applying ANOVA (*, P < 0.05; **, P < 0.0001). (C) The identical experiment as shown in panel A was performed on Pkd1+/+ (no. 11, 16, and 35) and Pkd1/ (no. 14, 19, and 38) MEFs as well as on Pkd Flox-1 MEFs, revealing increased phosphorylation of p70S6K, S6Rp, and 4EBP1 in Pkd1/ cells compared to the levels in Pkd1+/+ (right-hand histograms). Statistical analysis was performed by applying the Student's t test (*, P < 0.05). (D) The Pkd1/ MEFs (no. 14) were transiently transfected either with control siRNAs or with siRNAs directed against murine p70S6K and eIF4E. Combined silencing of the two molecules is able to reduce the cell size in these MEFs. Statistical analysis was performed by applying the Student's t test (*, P < 0.05).
FIG. 5.
FIG. 5.
PC-1 controls cell size in an Akt-independent manner and is able to downregulate the ERKs. (A) Control cell lines (F6 and F2) and MDCK PKD1 Zeo clones (C8/68 [68], G7/36 [36], and G3) were plated at 50% confluence in 0.5% serum for 12 h. Western blot analysis was carried out using anti-P-S6Rp, anti-P-Ser473-Akt, anti-P-Thr1462, and anti-P-Ser939-tuberin antibodies. Each blot was stripped and reprobed using antibodies against the total corresponding protein. (Inset blot) Anti-P-Ser939 antibodies are able to detect an increase in phosphorylation of tuberin in NIH 3T3 cells treated in the presence of PDGF (+) compared to those treated in the absence of PDGF (−), demonstrating the good quality of the antibodies. (B) Overexpression of wt-, DN-, or CA-Akt in the C8/68 clone revealed that DN-Akt is not able to regulate cell size, while both wt-Akt and CA-Akt are able to induce an increase in cell size, despite the equal transfection levels of all three constructs (top Western blot). (C) (Left) Control cell lines (F6 and F2) and MDCK PKD1 Zeo clones (C8/68 [68], G7/36 [36], and G3) were probed using antibodies against phosphorylated forms of MEK, ERK, and p90RSK, showing a dramatic downregulation of the ERK pathway. Blots were stripped and probed using anti-total MEK or anti-total p90RSK and revealed that no differences in loading could account for this downregulation. (Middle) Transient transfection of full-length PKD1-HA in NIH 3T3 cells, followed by Western blotting with anti-HA and anti-phospho-ERK antibodies. Transfection of PC-1 results in downregulation of phospho-ERKs. The blot was stripped and probed with total ERKs. (Right) Quantification of the phosphorylation levels of ERKs in stable MDCK transfectants (top) or in transiently transfected NIH 3T3 cells (bottom). Statistical analysis was performed by applying either ANOVA (top) or the Student's t test (bottom) (*, P < 0.05). (D) Cells were trypsinized, fixed, and double-stained for DNA content (DAPI) and with anti-phospho-ERK (left graph) or anti-phospho-S6Rp (right graph) antibodies. The content of phosphorylated molecules per single cell was evaluated in each phase of the cell cycle (see Materials and Methods).
FIG. 6.
FIG. 6.
CA-MEK reverts PC-1 control of cell size and mTOR. (A) A total of 12 μg of a construct encoding the catalytically active form of MEK (CA-MEK) was transiently transfected in control (F6) and MDCK PKD1 Zeo (C8/68) cells along with GFP, and then the cells were sorted and replated. Cells were analyzed for their cell size profiles 24 h after replating. CA-MEK was able to increase both the phosphorylation levels of S6Rp and the cell size. Anti-HA antibodies revealed that comparable expression levels were achieved in both controls and MDCK PKD1 Zeo cells. (B) Transient transfection of GFP alone or in combination with CA-MEK was carried out as described for panel A in the C8/68 cell line. Cells were treated in the presence or absence of rapamycin and subjected to Western blot analysis using antibodies against phospho-S6Rp or to FACS analysis to determine their FSC values, reflecting cell size. Treatment in the presence of rapamycin prevents the recovery of phospho-S6Rp (right) and cell size (left) induced by CA-MEK, demonstrating that CA-MEK acts through mTOR to exert its function. (C) GFP-positive cells transiently transfected as described for panel A were sorted, replated, serum starved overnight, and analyzed biochemically using the antibodies indicated. Transfection of CA-MEK in PKD1-overexpressing cells restores phosphorylation of both p70S6K and 4EBP1. Histograms on the right show the averages of quantifications of Western blots from at least three different experiments. Statistical analysis was performed by applying ANOVA (*, P < 0.05; **, P < 0.005; ***, P < 0.0001).
FIG. 7.
FIG. 7.
Impaired ERK and mTOR activities are responsible for increased cell size in Pkd1/ MEFs. (A) Western blot analysis of total lysates from Pkd1+/+ and Pkd1/ MEFs using anti-phospho-specific antibodies for MEK and ERKs revealed that the phosphorylation levels of these molecules are increased in Pkd1/ MEFs compared to the wt levels. Stripping and reprobing the same membrane using antibodies directed against the total levels of the same molecules revealed that all lanes were loaded equally. (B) (Top) Pkd1+/+ and Pkd1/ MEFs were treated in the presence or absence of the MEK inhibitor U0126. Statistical analysis was performed by applying ANOVA (*, P < 0.05; **, P < 0.005). (Bottom) Western blot analysis of the same samples shown on top revealed that treatment in the presence of U0126 diminishes the phosphorylation levels of S6Rp. (C) Identical experiment as described for panel B, except that cells were treated in the presence or absence of rapamycin to inhibit mTOR activity. Statistical analysis was performed by applying ANOVA (*, P < 0.05). (D) Transient transfection of siRNAs directed against murine ERK1 and -2 into Pkd1/ cells results in a significant reduction of the expression levels of the ERKs and, concomitantly, a significant reduction of cell size. Statistical analysis was performed by applying the Student's t test (*, P < 0.05).
FIG. 8.
FIG. 8.
PC-1 controls cell size and the mTOR pathway through regulation of tuberin phosphorylation in ERK-specific sites. (A) Transient transfection of GFP alone or in combination with a HA-PKD1 construct performed in Tsc2+/+; p53−/− or Tsc2−/−; p53−/− MEFs. (Top) HA-PKD1 was immunoblotted using anti-HA antibodies, revealing that equal expression levels for PC-1 are achieved in both cell lines. (Bottom) Statistical analysis of cell size quantification after synchronization in the G0/G1 phase of the cell cycle on triplicate transfections in Tsc2+/+ and Tsc2−/− MEFs reveals that PC-1 induces a statistically significant reduction in cell size only in Tsc2+/+ cells. Statistical analysis was performed by applying ANOVA (**, P < 0.005; ***, P < 0.0001). (B) Flag-tagged Tsc2 was transiently transfected in controls (F6 and F2), MDCK PKD1 Zeo clones (C8/68 [68], G7/36 [36], and G3), and Pkd1+/+ or Pkd1/ MEFs, immunoprecipitated using anti-Flag antibodies (M2 beads), and immunoblotted using an anti-phospho-S664 antibody. Filters were then stripped and probed using an antituberin antibody as a loading control. A decrease in the phosphorylation levels of this site in all three MDCK PKD1 Zeo cell lines was observed, while an increase occurred in the Pkd1/ MEFs. (C) Transient transfection of wt tuberin into Tsc2−/−; p53−/− cells decreases the size of cells, which is further enhanced by cotransfection of a PKD1-HA construct. (Top) Western blot analysis of tuberin and PC-1 (α-HA) in transiently transfected Tsc2−/−; p53−/− cells at 48 h posttransfection. (Bottom) Analysis of triplicate experiments reveals that coexpression of PC-1 and wt-TSC2 results in a statistically significant reduction of cell size over that with transfection of wt-TSC2 alone. Statistical analysis was performed by applying ANOVA (**, P < 0.005). Transient transfection of TSC2S540D/S664D (2D-TSC2) is not able to affect cell size, neither when transfected alone nor when cotransfected with PKD1.
FIG. 9.
FIG. 9.
Schematic representation of the proposed model. (A) Schematic representation of the dual mode of regulation of tuberin and the mTOR pathway in response to growth factors, as previously proposed by Ma et al. (24). Both the ERK and the Akt kinases can directly control the phosphorylation levels of tuberin, thus allowing for the double control of the pathway by growth factor receptors. (B) Proposed model for the regulation of the tuberin and mTOR pathway by PC-1. PC-1 induces activation of the PI3k/Akt pathway (3), but the pool of Akt activated in response to PC-1 is not able to phosphorylate Tsc2. At the same time, PC-1 overexpression downregulates the MEK/ERK pathway (our current work), resulting in reduced phosphorylation of tuberin and thus inhibition of mTOR. In ADPKD, the absence of PC-1 would result in the upregulation of the ERKs responsible for upregulating the mTOR pathway.

Similar articles

Cited by

References

    1. Ballif, B. A., P. P. Roux, S. A. Gerber, J. P. MacKeigan, J. Blenis, and S. P. Gygi. 2005. Quantitative phosphorylation profiling of the ERK/p90 ribosomal S6 kinase-signaling cassette and its targets, the tuberous sclerosis tumor suppressors. Proc. Natl. Acad. Sci. USA 102667-672. - PMC - PubMed
    1. Bhunia, A. K., K. Piontek, A. Boletta, L. Liu, F. Qian, P. N. Xu, F. J. Germino, and G. G. Germino. 2002. PKD1 induces p21(waf1) and regulation of the cell cycle via direct activation of the JAK-STAT signaling pathway in a process requiring PKD2. Cell 109157-168. - PubMed
    1. Boca, M., G. Distefano, F. Qian, A. K. Bhunia, G. G. Germino, and A. Boletta. 2006. Polycystin-1 induces resistance to apoptosis through the phosphatidylinositol 3-kinase/Akt signaling pathway. J. Am. Soc. Nephrol. 17637-647. - PMC - PubMed
    1. Boca, M., L. D'Amato, G. Distefano, R. S. Polishchuk, G. G. Germino, and A. Boletta. 2007. Polycystin-1 induces cell migration by regulating PI3kinase-dependent cytoskeletal rearrangements and GSK3-β dependent cell cell mechanical adhesion. Mol. Biol. Cell 184050-4061. - PMC - PubMed
    1. Boletta, A., F. Qian, L. F. Onuchic, A. K. Bhunia, B. Phakdeekitcharoen, K. Hanaoka, W. Guggino, L. Monaco, and G. G. Germino. 2000. Polycystin-1, the gene product of PKD1, induces resistance to apoptosis and spontaneous tubulogenesis in MDCK cells. Mol. Cell 61267-1273. - PubMed

Publication types

MeSH terms

Substances