. 2009 Mar 9;184(5):751-64.
doi: 10.1083/jcb.200812026. Epub 2009 Mar 2.

Munc18-1 binding to the neuronal SNARE complex controls synaptic vesicle priming

Affiliations

Munc18-1 binding to the neuronal SNARE complex controls synaptic vesicle priming

Ferenc Deák et al. J Cell Biol. .

Abstract

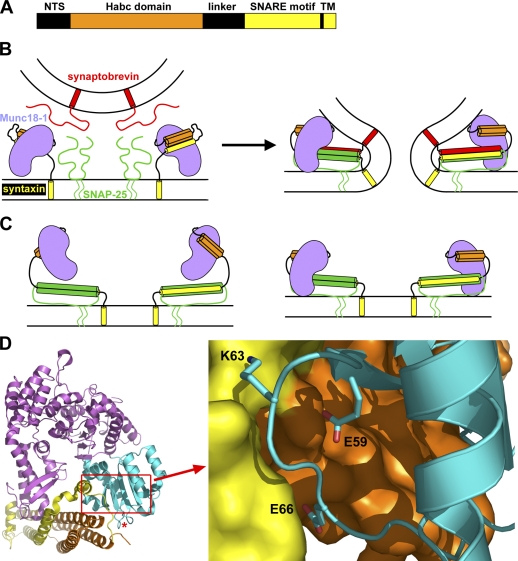
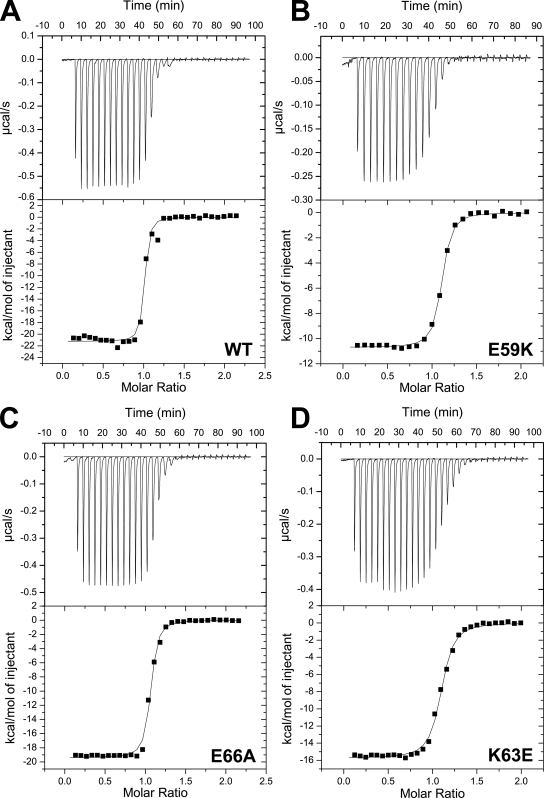
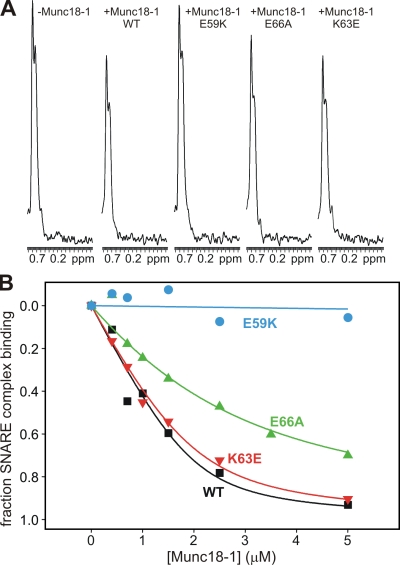
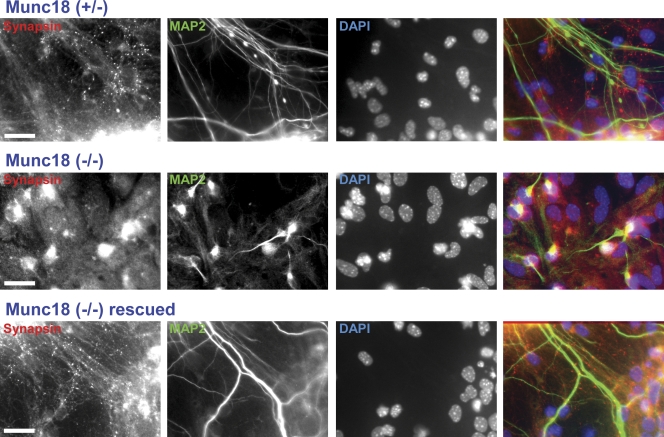
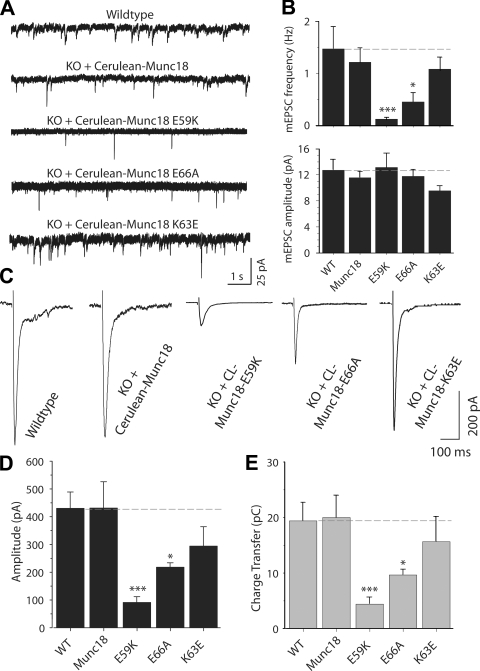
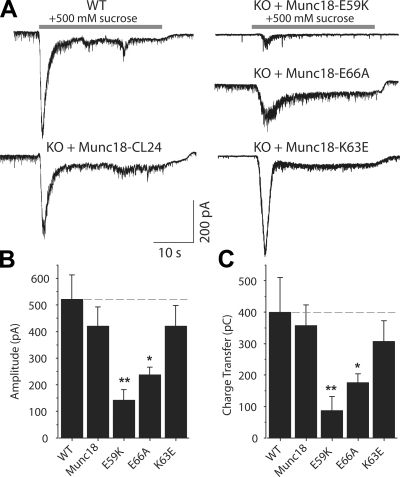
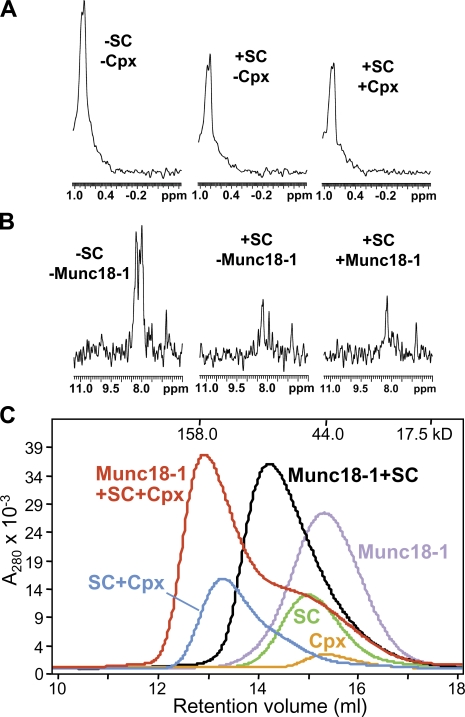
Munc18-1 and soluble NSF attachment protein receptors (SNAREs) are critical for synaptic vesicle fusion. Munc18-1 binds to the SNARE syntaxin-1 folded into a closed conformation and to SNARE complexes containing open syntaxin-1. Understanding which steps in fusion depend on the latter interaction and whether Munc18-1 competes with other factors such as complexins for SNARE complex binding is critical to elucidate the mechanisms involved. In this study, we show that lentiviral expression of Munc18-1 rescues abrogation of release in Munc18-1 knockout mice. We describe point mutations in Munc18-1 that preserve tight binding to closed syntaxin-1 but markedly disrupt Munc18-1 binding to SNARE complexes containing open syntaxin-1. Lentiviral rescue experiments reveal that such disruption selectively impairs synaptic vesicle priming but not Ca(2+)-triggered fusion of primed vesicles. We also find that Munc18-1 and complexin-1 bind simultaneously to SNARE complexes. These results suggest that Munc18-1 binding to SNARE complexes mediates synaptic vesicle priming and that the resulting primed state involves a Munc18-1-SNARE-complexin macromolecular assembly that is poised for Ca(2+) triggering of fusion.


Figures

Figure 1.
Figure 1.
Design of mutations to disrupt Munc18-1–SNARE interactions. (A) Domain diagram of syntaxin-1. NTS, N-terminal sequence; TM, transmembrane region. (B) Diagrams of the binary complex between Munc18-1 and closed syntaxin-1 (left) and the Munc18-1–SNARE complex assembly (right). Munc18-1 is purple, synaptobrevin is red, SNAP-25 is green, and syntaxin-1 is orange (Habc domain) and yellow (SNARE motif and transmembrane region). The model of the binary complex is based on its crystal structure (Misura et al., 2000; Burkhardt et al., 2008). The model of the Munc18-1–SNARE complex assemblies is based on NMR data suggesting a multifaceted interaction and illustrates the overall notion that these assemblies are critical for membrane fusion (Dulubova et al., 2007; and for a concrete physical model of how these assemblies can induce membrane fusion, see Rizo et al. [2006]). (C) Models of potential interactions between Munc18-1 and open syntaxin-1 within syntaxin-1–SNAP-25 heterodimers. The model on the left is based on the finding that Munc18-1 can bind to the isolated syntaxin-1 N-terminal region (Khvotchev et al., 2007; Burkhardt et al., 2008), whereas the model on the right also incorporates interactions with the SNARE motifs (Weninger et al., 2008). (D) Ribbon diagram of the binary Munc18-1–syntaxin-1 complex with Munc18-1 colored in purple except for the N-terminal domain, which is in cyan, and syntaxin-1, which is in orange (Habc domain) and yellow (linker and SNARE motif). The red asterisk indicates the position where cerulean was inserted for the rescue experiments. A close-up of the interface showing the mutated residues is shown on the right. The diagrams were prepared with Pymol (DeLano Scientific).
Figure 2.
Figure 2.
ITC analysis of binding of WT and mutant Munc18-1 to syntaxin-1. (A–D) Illustrative examples of the ITC data obtained for binding of WT Munc18-1 (A) and E59K (B), E66A (C), and K63E (D) Munc18-1 mutants to syntaxin-1(2–243) are shown. A polynomial baseline correction was applied to remove a slight drift in the initial points of each titration before fitting the data to a single-site binding model. This correction did not substantially alter the Kd values obtained.
Figure 3.
Figure 3.
Differential disruption of Munc18-1 binding to the SNARE complex by Munc18-1 point mutations. (A) Sample traces of the methyl regions of 1D 13C-edited 1H-NMR spectra of 2 µM SNARE complex containing uniformly 13C-labeled syntaxin-1(2–243) in the absence or presence of 2.5 µM of unlabeled WT or mutant Munc18-1s. ppm, parts per million. (B) Binding curves obtained from the SMR intensities observed in 1D 13C-edited 1H-NMR spectra of 2 µM SNARE complex containing uniformly 13C-labeled syntaxin-1(2–243) in the presence of increasing amounts of unlabeled WT or mutant Munc18-1s. The data were fit to a standard single-site binding model and normalized to the percentage of binding using as limit values the initial intensity in the absence of Munc18-1 (0% binding) and the intensity extrapolated to infinite Munc18-1 concentration (100% binding).
Figure 4.
Figure 4.
Rescue of neuronal survival in cortical cultures by Munc18-1 expression. Representative images of cortical synapses from littermate heterozygotes (top), homozygote KOs for Munc18-1 (middle), or Munc18-1 KOs infected with Munc18-1-containing lentivirus (bottom). Cells were maintained in culture for 11 d before being labeled with antibodies against the presynaptic marker synapsin (first column), the neurofilament marker MAP2 (second column), and the nuclear DAPI marker (third column). The last column shows the combined image of the three labeling procedures with colors that match the relevant labels in the other columns. Bars, 20 µm.
Figure 5.
Figure 5.
Synaptic release depends on Munc18-1 binding to the SNARE complex. (A) Analysis of spontaneous synaptic release upon rescue with WT and mutant Munc18-1s. Representative 10-s segments from 10-min-long traces of spontaneous excitatory synaptic activity, which was recorded at a holding potential of −70 mV in the presence of 1 µM tetrodotoxin and 50 µM picrotoxin. (B) Bar diagram describing the frequency (top) and amplitude (bottom) of spontaneous release (WT, n = 13; Munc18, n = 19; E59K, n = 10; K63E and E66A, n = 9). (C) Representative traces of field stimulation (at 0.4 Hz) evoked excitatory responses from neurons of WT (n = 14) or Munc18-1 KO infected with WT (n = 9), E59K (n = 7), E66A (n = 16), or K63E (n = 11) Munc18-1–24-cerulean. Note that only the first 400 ms of the traces are shown for clarity. (D) Bar diagram summarizing the amplitudes of evoked responses for cultures rescued with the WT Munc18-1 and different Munc18-1 mutants. (E) Synaptic responses characterized as the amount of transferred charge. Asterisks in the bar diagrams mark statistical significance of the difference between the WT and mutant rescues (*, P < 0.05; ***, P < 0.005). (B, D, and E) Data are shown as means ± SEMs. Dashed lines indicate WT values.
Figure 6.
Figure 6.
Munc18-1 binding to the SNARE complex is critical for release readiness of synaptic vesicles. (A) Representative traces of synaptic excitatory responses to hypertonic solution (+500 mM sucrose to the bath) in WT neurons from littermate controls and Munc18-1 KO neurons rescued with lentivirus-expressing WT Munc18-1–24-cerulean or Munc18-1–24-cerulean with the E59K, K63E, or E66A mutations. (B) Bar diagram depicting the amplitudes of responses to hypertonic sucrose solution for WT cultures or Munc18-1 KO cultures rescued with the WT and mutant Munc18-1s (WT, n = 5; Munc18-1, K63E, and E66A, n = 8; E59K, n = 5). (C) Readily releasable synaptic excitatory transmission characterized as the amount of charge transfer induced by hypertonic sucrose. Asterisks in the bar diagrams mark statistical significance of the difference between the WT and mutant rescues (*, P < 0.05; **, P < 0.01). (B and C) Data are shown as means ± SEMs. Dashed lines indicate WT values.
Figure 7.
Figure 7.
Munc18-1 and complexin-1 can bind simultaneously to the SNARE complex. (A) Sample traces of the methyl regions of 1D 13C-edited 1H-NMR spectra of 2 µM Munc18-1 in the absence or presence of 2 µM of unlabeled SNARE complex or 2 µM of unlabeled SNARE complex plus 2 µM 15N-labeled complexin-1. (B) Sample traces of 1D 15N-edited 1H-NMR spectra of 2 µM 15N-labeled complexin-1 in the absence or presence of 2 µM of unlabeled SNARE complex or 2 µM of unlabeled SNARE complex plus 2 µM 13C-labeled Munc18-1. (A and B) The spectra on the right were acquired with the same sample. ppm, parts per million. (C) Gel filtration on a Superdex S200 (10/300GL) column of Munc18-1, complexin-1, SNARE complex (SC), and mixtures of the SNARE complex with Munc18-1, complexin (Cpx), or both. The SNARE complexes used for all of these experiments contained syntaxin-1(2–253), synaptobrevin-2(29–93), SNAP-25(11–82), and SNAP-25(141–203).

References

    1. Arac D., Murphy T., Rizo J. 2003. Facile detection of protein-protein interactions by one-dimensional NMR spectroscopy.Biochemistry. 42:2774–2780 - PubMed
    1. Atwell S., Ultsch M., De Vos A.M., Wells J.A. 1997. Structural plasticity in a remodeled protein-protein interface.Science. 278:1125–1128 - PubMed
    1. Bracher A., Weissenhorn W. 2002. Structural basis for the Golgi membrane recruitment of Sly1p by Sed5p.EMBO J. 21:6114–6124 - PMC - PubMed
    1. Brunger A.T. 2005. Structure and function of SNARE and SNARE-interacting proteins.Q. Rev. Biophys. 38:1–47 - PubMed
    1. Burkhardt P., Hattendorf D.A., Weis W.I., Fasshauer D. 2008. Munc18a controls SNARE assembly through its interaction with the syntaxin N-peptide.EMBO J. 27:923–933 - PMC - PubMed

Publication types

MeSH terms