. 2009 Mar 9;184(5):691-706.
doi: 10.1083/jcb.200807179. Epub 2009 Mar 2.

Mammalian end binding proteins control persistent microtubule growth

Affiliations

Mammalian end binding proteins control persistent microtubule growth

Yulia Komarova et al. J Cell Biol. .

Abstract

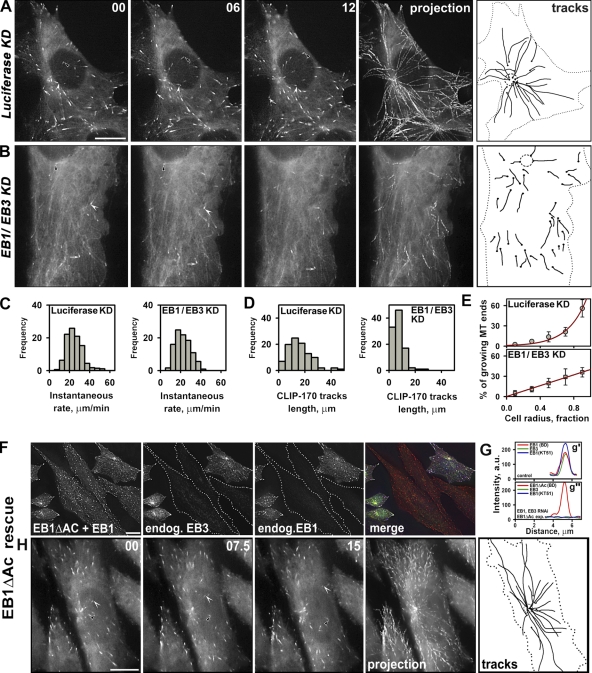
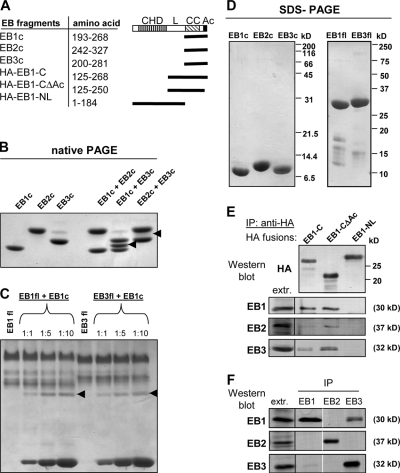
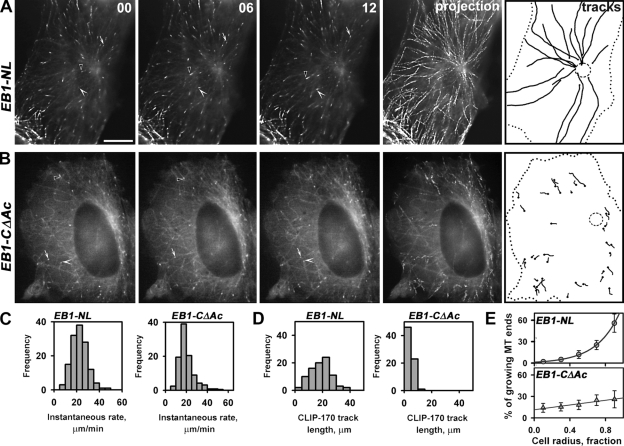
End binding proteins (EBs) are highly conserved core components of microtubule plus-end tracking protein networks. Here we investigated the roles of the three mammalian EBs in controlling microtubule dynamics and analyzed the domains involved. Protein depletion and rescue experiments showed that EB1 and EB3, but not EB2, promote persistent microtubule growth by suppressing catastrophes. Furthermore, we demonstrated in vitro and in cells that the EB plus-end tracking behavior depends on the calponin homology domain but does not require dimer formation. In contrast, dimerization is necessary for the EB anti-catastrophe activity in cells; this explains why the EB1 dimerization domain, which disrupts native EB dimers, exhibits a dominant-negative effect. When microtubule dynamics is reconstituted with purified tubulin, EBs promote rather than inhibit catastrophes, suggesting that in cells EBs prevent catastrophes by counteracting other microtubule regulators. This probably occurs through their action on microtubule ends, because catastrophe suppression does not require the EB domains needed for binding to known EB partners.


Figures

Figure 1.
Figure 1.
Effects of depletion of individual EBs on the distribution of other EB1 family members. (A–D) Immunofluorescent staining of the CHO-K1 cells for EB1, EB2, and EB3 after knocking down EB1 (A); EB2 (B); EB3 (C); or EB1 and EB3 simultaneously (D). EB-depleted cells are indicated by dotted lines. Bar, 10 µm. Enlarged insets from control (1) and EB-depleted cells (2) are shown in color; EB1 is red, EB2 is green, and EB3 is blue in the overlays. Bar, 5 µm. Averaged intensity distributions for each EB protein (±SEM) were obtained for 15–25 MT ends per condition; the values obtained in control cells from each experiment were used for normalization. Intensity distributions are shown for a control cell (a) and for cells depleted of EB1 (a′), EB2 (b), EB3 (c), or EB1 and EB3 simultaneously (d).
Figure 2.
Figure 2.
Simultaneous depletion of EB1 and EB3 disrupts persistent MT growth. (A and B) Time-lapse sequence of YFP-CLIP-170 in cells expressing shRNAs either to luciferase (control) (A) or to EB1 and EB3 (B). Images were acquired every 2 s. Three tips of CLIP-170 “comets” are indicated by an arrow, an arrowhead, and a black-and-white arrowhead. Projection analysis (20 successive frames) and diagrams of trajectories of individual CLIP-170 comets illustrate episodes of uninterrupted MT growth. The centrosome region is indicated by a dashed circle; the cell border is shown by a dotted line. Time in seconds is in the top right corner. Bar, 10 µm. (C and D) Histograms of MT growth rates and the lengths of YFP-CLIP-170 tracks in control (luciferase) and EB1/EB3 shRNA-expressing cells. (E) Distribution of the growing MT plus-ends along the cell radius in control and EB1/EB3-depleted cells; error bars indicate SD. The cell radius was divided into five zones (each zone was a 0.2 fraction of the cell radius) and the number of YFP-CLIP-170–positive tips were scored for each zone (∼600 MT tips in 8–12 cells for each condition). The results are represented as percentage of the MTs within each zone where 100% is a total number of the scored growing plus-ends in the cell. (F and G) Rescue of EB1/EB3 depletion by EB1ΔAc. (F) EB1/EB3-depleted cells expressing EB1ΔAc are indicated by dotted lines. EB3 was detected with rabbit antibodies (green in overlay); EB1 was stained with the mouse antibody from BD Biosciences, which detects both the endogenous EB1 and EB1ΔAc (left panel; red in overlay); and the rat antibody KT51 (Absea), specific for the acidic tail of EB1, was used to stain the endogenous EB1 but not EB1ΔAc (right panel; blue in overlay). (G) Intensity distribution shows that the levels of endogenous EB1 and EB3 in EB1ΔAc-rescued cells were negligible (green and blue lines in panel g′′); level of EB1ΔAc (red line in panel g′′) was similar to the level of endogenous EB1 (red line in panel g′). (H) Time-lapse sequence of YFP-CLIP-170 in the cells coexpressing shRNAs to EB1/EB3 and EB1ΔAc rescue construct; images were acquired every 2.5 s. Tips of CLIP-170 comets are indicated by white and black-and-white arrowheads. Projection analysis and trajectories of individual YFP-CLIP-170 comets are generated in the same way as in panel A. Time in seconds is in the top right corner. Bar, 10 µm.
Figure 3.
Figure 3.
The C-terminal domain of EB1 heterodimerizes with the full-length EBs. (A) Schematic representation of EB constructs used for the heterodimerization and co-IP assays. CHD, calponin homology domain; L, linker; CC, coiled coil; Ac, acidic tail. (B and C) Analysis of the indicated proteins or protein mixtures by native 15% (B) or 9% (C) PAGE at 4°C. EBc fragments were mixed in an equimolar ratio (B); EB1c and the full-length EB1 and EB3 were mixed in different ratios as indicated (C). Heterodimers are indicated by arrowheads. (D) Analysis of the indicated proteins by denaturing SDS-PAGE; molecular weight markers are indicated on the right. (E) Co-IPs of HA-tagged EB1 mutants expressed in COS-1 with an HA antibody. Western blots were probed with the indicated antibodies. EB1-C and EB1-CΔAc but not EB1-NL co-precipitate the endogenous EBs. Extr. = 10% of the cell extract, used for IP. (F) Co-IPs of endogenous EBs from COS-1 cells. Extr. = 10% of the cell extract, used for IP.
Figure 4.
Figure 4.
Expression of the dominant-negative EB1 mutant disrupts persistent MT growth in CHO-K1 cells. (A and B) Representative time-lapse images of YFP-CLIP-170 in cells expressing HA-EB1-NL (control) and HA-EB1-CΔAc (dominant negative) mutants. Images were acquired every 2 s. Tips of three YFP-CLIP-170 comets are indicated over time by an arrow, an arrowhead, and a black-and-white arrowhead. Projection analysis and trajectories of individual YFP-CLIP-170 comets are generated in the same way as in Fig. 2 A. Time in seconds is shown in the top right corner. Bar, 10 µm. (C and D) Histograms of the instantaneous MT growth rates and the lengths of YFP-CLIP-170 tracks in HA-EB1-NL and HA-EB1-CΔAc-expressing cells. (E) Distributions of the growing MT plus-ends along the cell radius in EB1-NL and EB1-CΔAc–expressing cells presented as in Fig. 2 E; error bars represent SD.
Figure 5.
Figure 5.
Monomeric N terminus of EB3 tracks growing MT ends in cells. (A) Live images of CHO-K1 cells transfected with GFP-EB1-CΔAc alone or together with EB3-mRFP. Images were processed by applying Blur filter and Unsharp Mask in Photoshop. Bar, 5 µm. (B–G) Live images of control CHO-K1 cells (B–D) or EB1/EB3-depleted cells (E–G) expressing the indicated constructs. Cells expressing similar low levels of the fusion proteins were selected based on average fluorescence intensity. Bar, 5 µm. (H) Ratio of fluorescence intensities at the growing MT tips and in surrounding cytoplasm (after background subtraction), measured from live cell images obtained as described for panels B–G. 10 cells (45–200 MT tips) were measured for each construct; error bars represent SD. The differences between the indicated values were significantly different; statistical analysis was performed using nonparametric Mann-Whitney U test.
Figure 6.
Figure 6.
Monomeric N terminus of EB3 tracks growing MT ends in vitro. (A–D) In vitro MT plus-end tracking assay. Representative TIRFM images (A and C) and kymographs (B and D) show specific accumulation of GFP-EB3 (100 nM) and EB3-NL-mVenus (100 nM) at the growing, but not shortening MT plus (+) and minus (−) ends. Horizontal bars, 5 µm; vertical bar, 60 s. (E) Dual-color imaging of in vitro plus-end tracking assays performed with the indicated concentrations of EB3-NL-mVenus and mCherry-EB3. Images were processed by applying Blur filter in Photoshop. Bar, 1 µm. (F) Ratio of fluorescence intensity at the growing MT tip and on the MT lattice for the indicated protein mixtures (after background subtraction). Green plots show measurements for EB3-NL-mVenus and red plots for mCherry-EB3. 10–20 MT tips were measured per experiment; error bars represent SD.
Figure 7.
Figure 7.
Rescue of processive MT growth by different EB3 fusions and EB2-EB3 chimeras in EB1/EB3-delpeted cells. The proportion of MT tracks originating from the centrosome, with the length exceeding 7.5 µm, schematic representations of the constructs, amino acid positions in EB3 and EB2, and the numbers of tracks and cells analyzed for each construct are indicated. Share of long MT growth episodes in control cells, EB1/EB3-depleted cells, and cells expressing HA-EB1-ΔAc obtained using GFP-CLIP-170 or mCherry–α-tubulin (after photobleaching) is shown for comparison. Cells with approximately the same radius were selected for quantification. Error bars indicate SD determined based on 2–4 independent experiments.
Figure 8.
Figure 8.
Structural analysis of EB-CH domains. (A) Sequence alignment of the three human EB homologues. Residue assignment and secondary structure elements are indicated on the top of the alignment. Residues colored in red and green indicate the differences between EB3 and EB2 (EB2 sequence) and EB3 and EB1 (EB1 sequence), respectively. Residues highlighted in blue in the EB1 sequence were shown to affect MT association in cells; in gray, residues that do not affect MT binding (Slep and Vale, 2007). (B) X-ray crystal structure of EB3-CH domain (yellow ribbon) overlaid onto the ones of EB1 (green ribbon; PDB entry 1pa7) and Bim1 (magenta ribbon; PDB entry 2qjx). (C and D) Two views of the EB3-CH domain, 150° apart and in surface representation. EB3 residue assignments are indicated. Both panels depict sequence differences between EB3 and EB2 and between EB3 and EB1. The color code is the same as in (A) with the addition that simultaneous residue changes in both EB1 and EB2 are indicated in orange if it is unknown whether they influence MT binding, light orange if they do not affect MT binding, and in purple if they do (Slep and Vale, 2007).

Similar articles

Cited by

References

    1. Akhmanova A., Steinmetz M.O. 2008. Tracking the ends: a dynamic protein network controls the fate of microtubule tips.Nat. Rev. Mol. Cell Biol. 9:309–322 - PubMed
    1. Arnold K., Bordoli L., Kopp J., Schwede T. 2006. The SWISS-MODEL workspace: a web-based environment for protein structure homology modelling.Bioinformatics. 22:195–201 - PubMed
    1. Askham J.M., Vaughan K.T., Goodson H.V., Morrison E.E. 2002. Evidence that an interaction between EB1 and p150(Glued) is required for the formation and maintenance of a radial microtubule array anchored at the centrosome.Mol. Biol. Cell. 13:3627–3645 - PMC - PubMed
    1. Bieling P., Laan L., Schek H., Munteanu E.L., Sandblad L., Dogterom M., Brunner D., Surrey T. 2007. Reconstitution of a microtubule plus-end tracking system in vitro.Nature. 450:1100–1105 - PubMed
    1. Bieling P., Kandels-Lewis S., Telley I.A., van Dijk J., Janke C., Surrey T. 2008. CLIP-170 tracks growing microtubule ends by dynamically recognizing composite EB1/tubulin-binding sites.J. Cell Biol. 183:1223–1233 - PMC - PubMed

Publication types

Substances