. 2009 Mar 9;184(5):707-19.
doi: 10.1083/jcb.200809060. Epub 2009 Mar 2.

Bcl-x L increases mitochondrial fission, fusion, and biomass in neurons

Affiliations

Bcl-x L increases mitochondrial fission, fusion, and biomass in neurons

Sarah B Berman et al. J Cell Biol. .

Abstract

Mitochondrial fission and fusion are linked to synaptic activity in healthy neurons and are implicated in the regulation of apoptotic cell death in many cell types. We developed fluorescence microscopy and computational strategies to directly measure mitochondrial fission and fusion frequencies and their effects on mitochondrial morphology in cultured neurons. We found that the rate of fission exceeds the rate of fusion in healthy neuronal processes, and, therefore, the fission/fusion ratio alone is insufficient to explain mitochondrial morphology at steady state. This imbalance between fission and fusion is compensated by growth of mitochondrial organelles. Bcl-x(L) increases the rates of both fusion and fission, but more important for explaining the longer organelle morphology induced by Bcl-x(L) is its ability to increase mitochondrial biomass. Deficits in these Bcl-x(L)-dependent mechanisms may be critical in neuronal dysfunction during the earliest phases of neurodegeneration, long before commitment to cell death.


Figures

Figure 1.
Figure 1.
Short mitochondrial morphology in mouse cortical neurons lacking Bcl-xL. (A) Representative immunoblot of control and bcl-x cKO cortical cultures 4 DIV confirms Bcl-xL deficiency (Boise polyclonal). (B) Immunofluorescence microscopy images show paired cortical cultures (4 DIV) stained with anti–Bcl-xL (Biocarta polyclonal, red) and with DAPI to mark cell nuclei (blue); neurons were identified by costaining with anti-NeuN (not depicted). (C) Proportions of the indicated cell types present in bcl-x cKO cortical neuron cultures (2 DIV) were identified by immunofluorescence microscopy as described in D and quantified; n = 6 samples per genotype in two independent experiments. (D) Immunofluorescence microscopy for Cre recombinase (red) and NeuN (green) in bcl-x cKO cortical cultures (2 DIV); Hoechst 33258 (blue) marks nuclei. Numbered arrows are defined in C. Note, both control and cKO mice have one copy of NEX replaced by Cre recombinase; only control mice contain an unfloxed copy of bcl-x. (E) Viability of Cre-positive neurons in bcl-x cKO (bcl-xflox/flox;cre+/−) and control (bcl-x+/flox;cre+/−) embryonic cortical cultures was determined by nuclear morphology with Hoechst 33258 staining in three independent experiments presented as mean ± SEM (t test, P = 0.01). (F) Representative images of control and bcl-x cKO cortical neurons (8 DIV) transfected with mito-RFP. (G) Mitochondrial length was quantified in three independent experiments as in F and presented as mean ± SEM; n = 1,362 mitochondria from 38 control neurons, and n = 813 mitochondria from 30 bcl-x cKO neurons. t test; *, P < 0.0001
Figure 2.
Figure 2.
Elongated mitochondrial morphology in neurons overexpressing Bcl-xL and dnDrp1K38A. (A) Fluorescent microscopy images of rat cortical neuron processes 1 d after transfection with mito-RFP (and mtPA-GFP) plus the indicated constructs or empty vector control. (B) Data from 96–131 mitochondria in four independent experiments as shown in A were quantified and presented as mean ± SEM. All six paired comparisons are statistically different (p < 0.001) except dnDrp1 versus Bcl-xL + dnDrp1 (marked with an X). See “Computational methods” and Table S1 (available at http://www.jcb.org/cgi/content/full/jcb.200809060/DC1).
Figure 3.
Figure 3.
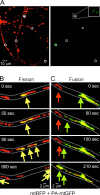
High magnification time series of mitochondrial fusion and fission in neuronal processes (DrOF). (A) Representative images of rat cortical neurons (8 DIV) cotransfected with mito-RFP and mito–PA-GFP at 7 DIV. In the red channel, mitochondria were selected for photoactivation at 405 nm (circled areas), thereby activating green fluorescence (right). (B) Selected images (merge of red and green channels) from a series of 90 frames taken at 10-s intervals reveal a rare photoactivated mitochondrion undergoing two fission events to produce three mitochondria that subsequently migrate out of view (yellow arrows). Dotted lines approximately outline the neuronal process (see Video 2, available at http://www.jcb.org/cgi/content/full/jcb.200809060/DC1). (C) Example of a photoactivated mitochondrion (green arrows) that fuses to a neighboring unactivated (red) mitochondrion (see panel B and Video 4).
Figure 4.
Figure 4.
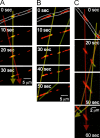
Most mitochondrial encounters/visitations do not result in fusion. (A–C) Fluorescence microscopy images of merged (red + green) channels as described for Fig. 3. Dotted lines approximately outline the neuronal processes. Transparent arrows/lines track the same mitochondrion. (A) A mitochondrion (red, not photoactivated) moves past a yellow photoactivated mitochondrion without exchanging contents. The indicated imaging times are relative to the earliest frame shown. (B) Activated (yellow) mitochondria move past stationary/slow unactivated (red) mitochondria without exchanging contents. (C) Two adjacent/overlapping mitochondria (one photoactivated) move at similar velocities without fusing to each other or to a third stationary mitochondrion.
Figure 5.
Figure 5.
Proportions of mitochondria in rat cortical neurons undergoing fission and fusion events determined by DrOF (see Fig. 3). (A) The proportion of activated mitochondria observed to undergo fission. The total number of events for the indicated number of mitochondria was tabulated for eight independent experiments. Statistical significance was calculated using binomial tests for proportions; *, P < 0.05; **, P < 0.002; ***, P < 0.001. Note, the Bonferroni-corrected 95% confidence level is 0.05/6 = 0.0083. (B) The proportion of activated mitochondria observed to undergo fusion. Statistical significance was calculated using binomial tests for proportions (dashed lines are corrected by a factor of one half); *, P < 0.007; **, P < 0.003. (C) Data from B divided by factor of 2 to correct for bias caused by observation of only activated mitochondria.
Figure 6.
Figure 6.
Bcl-xL induces Drp1-dependent mitochondrial fission. (A) Diagrammatic tubular mitochondrial segments of indicated lengths corresponding to control and Bcl-xL–expressing neurons from Fig. 2 B. These illustrate the distribution of Drp1-containing fission complexes as a function of organelle length. Drp1 molecules (balls) in complexes distributed along mitochondria mark potential sites of future fission events, which implies that the probability of a fission event is proportional to the length of the organelle, with all other conditions being constant. (B) The probability of mitochondrial fission (pfi) per micrometer of mitochondrial length per hour was calculated as described in “Computational methods” (see Table S2, available at http://www.jcb.org/cgi/content/full/jcb.200809060/DC1). P = 0.0002 for all six paired comparisons except for dnDrp1 versus dnDrp1+ Bcl-xL, which was not significant (marked with an X). (C) Diagram illustrating the findings from B. (D) Mitochondrial fission/fusion ratios were calculated from the results shown in Fig. 5 and converted to events per hour. The dotted line marks the theoretical fission/fusion ratio of 1; error bars indicate 25% and 75% bootstrapped quantiles. (E) During steady-state, the number and mass of mitochondria per cell (boxes) must remain equal. This is achieved by an unknown relationship between mitochondrial fission, fusion, biogenesis, and degradation. Parenthetic values for mitochondrial numbers are derived from fission/fusion ratios in Bcl-xL–expressing neurons determined in D.
Figure 7.
Figure 7.
Bcl-xL promotes Drp1-independent mitochondrial growth. (A) The number density of mitochondrial organelles was determined as the number of mitoRFP-expressing mitochondria per 100 microns of neuron process in four independent experiments per condition and presented as mean ± SEM. **, P < 0.003 compared with vector or Bcl-xL, except vector compared to both; *, P < 0.03. See “Computational methods” and Table S2 (available at http://www.jcb.org/cgi/content/full/jcb.200809060/DC1). (B) Mitochondrial mass was approximated using the formula: [(mean mitochondrial length from Fig. 2 B) × (mitochondrial number density/micrometer from panel A)]; SEM < 0.03 for all conditions. Bootstrap significance tests were used for effective mitochondrial mass; *, P < 0.02; **, P < 0.002; ***, P = 0.0002 compared with vector control. (C) Diagram of findings from B. (D) Bcl-xL increases the mitochondrial content of hippocampal neuronal processes determined by electron microscopy. The total area of neuronal processes that was occupied by mitochondria was calculated for at least 50 mitochondria per condition in 19 images for GFP–Bcl-xL and in 29 images of GFP, and presented as mean ± SEM. t test; *, P < 0.002. (E) The area within control and bcl-x cKO mouse cortical neurons (6–8 DIV) that is occupied by mitochondria was determined by immunofluorescence microscopy for cytochrome c and analyzed using ImageJ. Neurons were identified by staining with anti-Cre (not depicted). Data are presented as mean ± SEM for 28–34 healthy neurons in 9–10 independent cultures per condition in two experiments. t test; *, P < 2 × 10⁻⁷. (F) Immunoblots of lysates and indicated subcellular fractions prepared from transiently transfected HeLa cells. Some lanes from the same exposures of the same blots were rearranged for presentation. Bcl-xL was estimated by densitometry to increase VDAC levels in mitochondrial fractions over loading control by 2.7-fold (as shown), and in two additional independent experiments by 13.0-fold and 2.3-fold. These values do not take into account <100% transfection efficiency. Molecular mass markers are shown (kD).

Similar articles

Cited by

References

    1. Adams J.M., Cory S. 2007. Bcl-2-regulated apoptosis: mechanism and therapeutic potential.Curr. Opin. Immunol. 19:488–496 - PMC - PubMed
    1. Amiri M., Hollenbeck P.J. 2008. Mitochondrial biogenesis in the axons of vertebrate peripheral neurons.Dev. Neurobiol. 68:1348–1361 - PMC - PubMed
    1. Barsoum M.J., Yuan H., Gerencser A.A., Liot G., Kushnareva Y., Graber S., Kovacs I., Lee W.D., Waggoner J., Cui J., et al. 2006. Nitric oxide-induced mitochondrial fission is regulated by dynamin-related GTPases in neurons.EMBO J. 25:3900–3911 - PMC - PubMed
    1. Basanez G., Hardwick J.M. 2008. Unravelling the bcl-2 apoptosis code with a simple model system.PLoS Biol. 6:e154. - PMC - PubMed
    1. Benard G., Rossignol R. 2008. Ultrastructure of the mitochondrion and its bearing on function and bioenergetics.Antioxid. Redox Signal. 10:1313–1342 - PubMed

Publication types