. 2009 Mar 21;9(6):768-76.
doi: 10.1039/b814322f. Epub 2008 Dec 5.

A timer-actuated immunoassay cassette for detecting molecular markers in oral fluids

Affiliations

A timer-actuated immunoassay cassette for detecting molecular markers in oral fluids

Changchun Liu et al. Lab Chip. .

Abstract

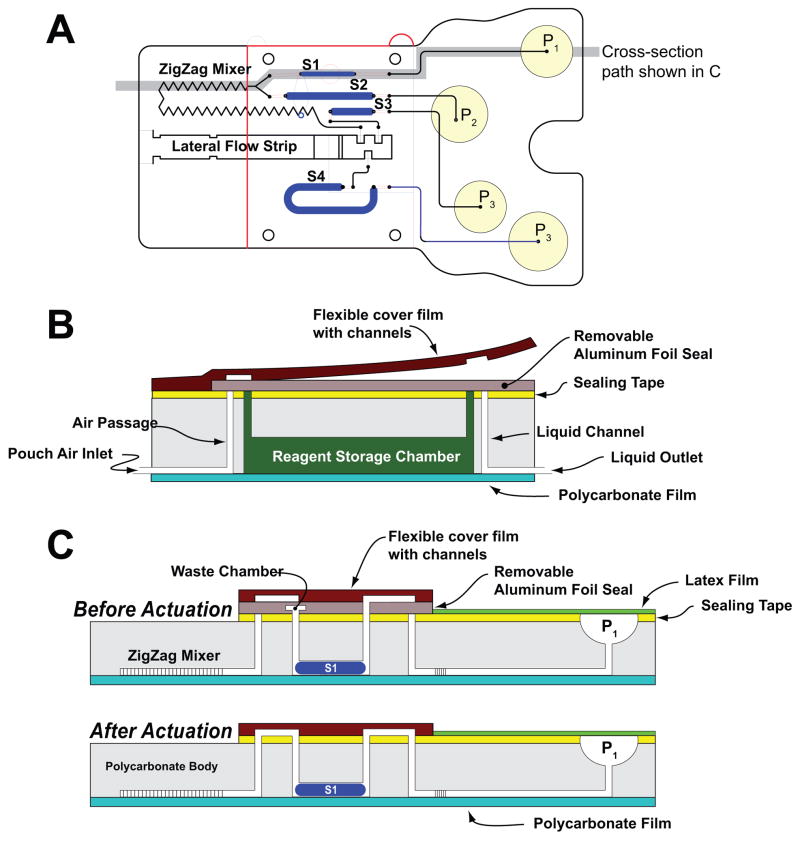
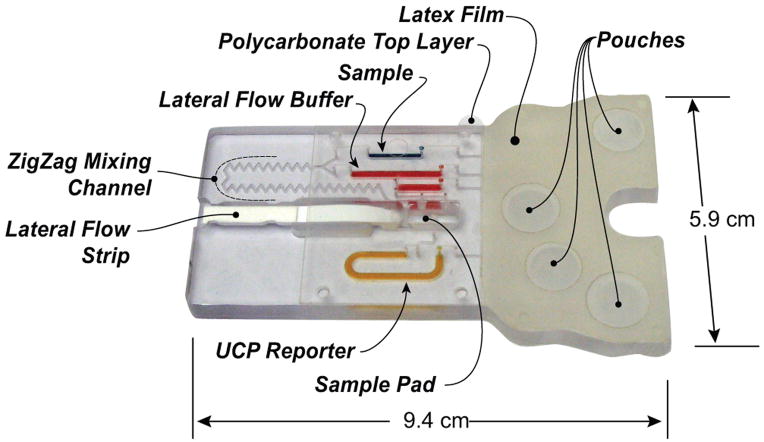
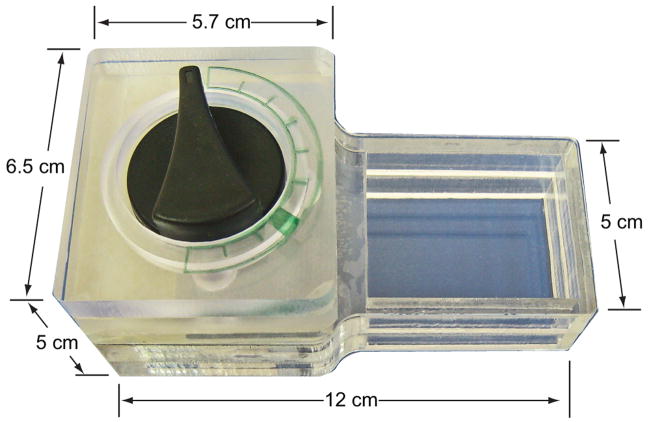
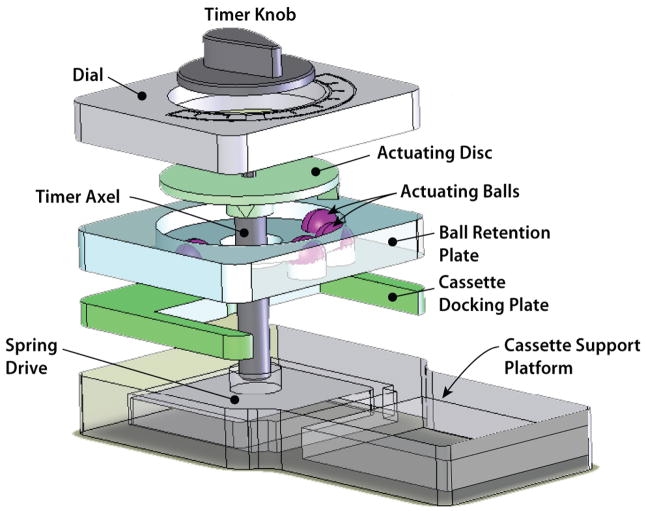
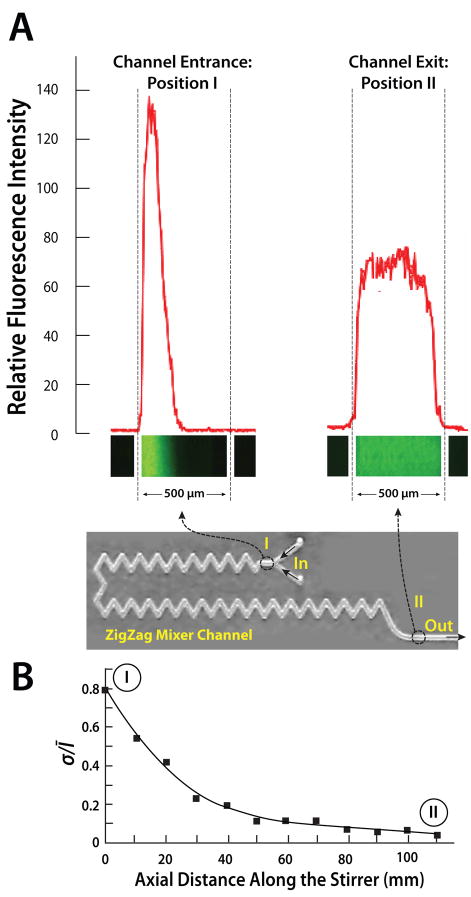
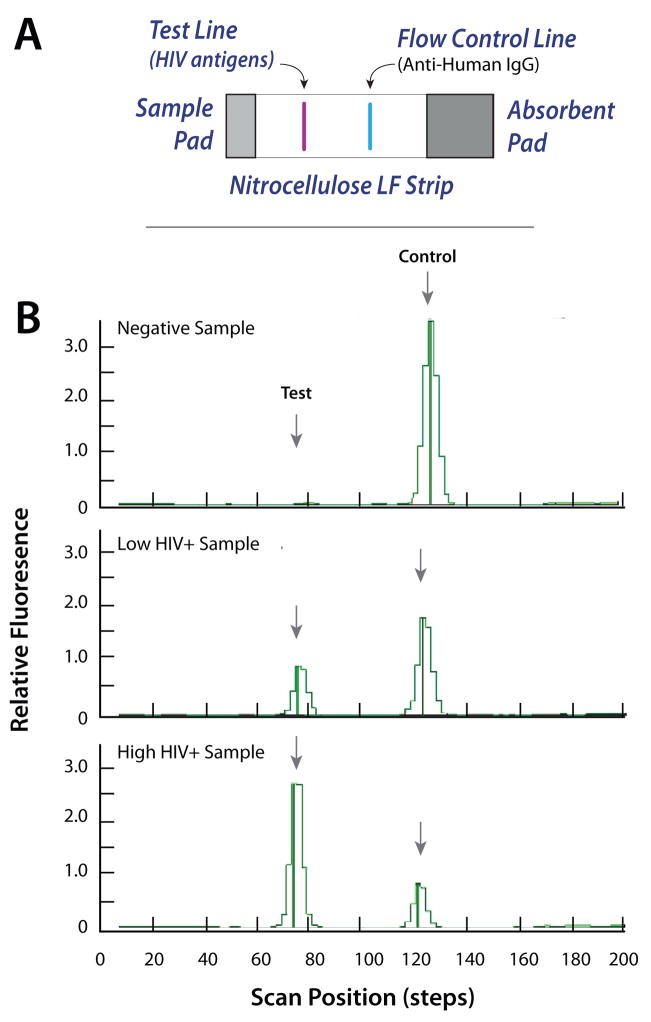
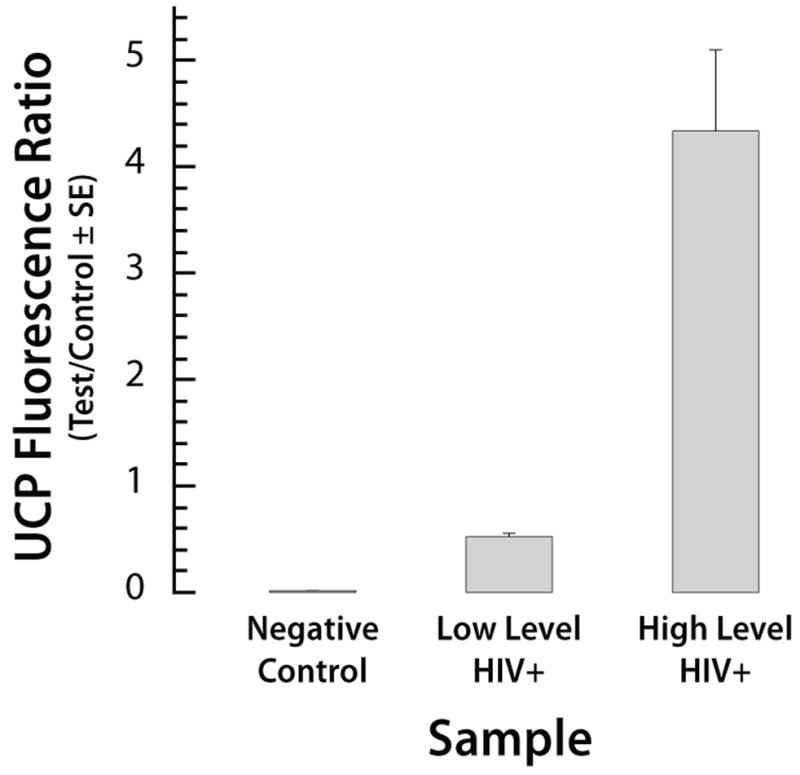
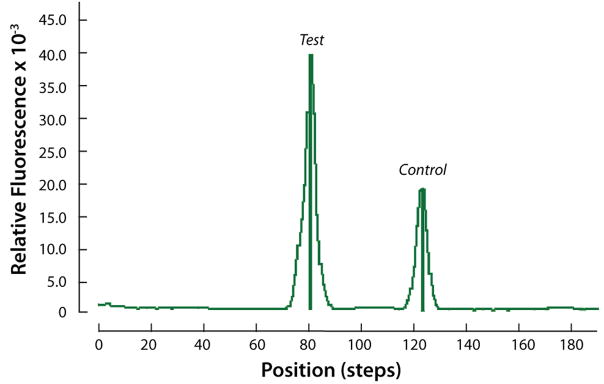
An inexpensive, hand-held, point-of-care, disposable, self-contained immunoassay cassette comprised of air pouches for pumping, a metering chamber, reagents storage chambers, a mixer, and a lateral flow strip was designed, constructed, and tested. The assay was carried out in a consecutive flow format. The detection was facilitated with up-converting phosphor (UCP) reporter particles. The automated, timely pumping of the various reagents was driven by a spring-loaded timer. The utility of the cassette was demonstrated by detecting antibodies to HIV in saliva samples and further evaluated with a non-contagious, haptenized DNA assay. The cassette has several advantages over dip sticks such as sample preprocessing, integrated storage of reagents, and automated operation that reduces operator errors and training. The cassette and actuator described herein can readily be extended to detect biomarkers of other diseases in body fluids and other fluids at the point of care. The system is particularly suitable for resource-poor countries, where funds and trained personnel are in short supply.


Figures

Fig. 1
Fig. 1
A schematic depiction of the polycarbonate fluidic chip consisting of air pouches (P1–P4), a metering chamber (S1), reagents storage chambers (S2–S4), a zigzag mixer, and a lateral flow (LF) strip. (A) top view; (B) cross-section along the width of the cassette in its storage (pre-activation) state; (C) cross-sections along the length of the cassette prior (top) and after (bottom) the cassette activation.
Fig. 2
Fig. 2
A photograph of the assembled immunoassay cassette that consists of latex rubber film, flexible polymer film with connecting conduits, double-sided tape, lateral flow strip, stored reagents, and sample. For better visibility, the various storage chambers are filled with dyes (blue=sample; red=LF buffer; orange= UCP reporter buffer)
Fig. 3
Fig. 3
A photograph of the hand-held, timer-based actuator
Fig. 4
Fig. 4
An exploded view of the actuating mechanism of the timer-based actuator. After the knob is turned clockwise to a preset position and the timer is set, the self-contained immunoassay cassette is inserted into the cassette bay of the actuator and the actuating disc rotates counter-clockwise. The protrusions of the rotating disc deform the flexible films of the air pouches and discharge the air to displace the sample and various reagents in a timely fashion.
Fig. 5
Fig. 5
A photograph of the zigzag mixer in the cassette combined with images of the fluorescent intensities at the stirrer’s inlet (I) and exit (II) as a function of the conduit’s width (A). The fluorescent images were captured with a CCD camera. The Reynolds number of the flow (based on the hydraulic diameter) is 5. (B) The standard deviation of the fluorescence intensity, normalized with the average intensity, is depicted as a function of the conduit’s length.
Fig. 6
Fig. 6
(A) the lateral flow strip consists of a sample pad, a nitrocellulose membrane, and an adsorbent pad. The nitrocellulose strip is equipped with a test line and a control line. (B) Emission profiles (scan results) of negative, low positive, and high positive HIV samples. The signals (in relative fluorescent units) are depicted as functions of position along the strip.
Fig. 7
Fig. 7
The ratio of the test and the control signals for the HIV test using negative, low positive, and high positive samples. The signals correspond to the areas under the peaks. The error bars correspond to the scatter of the data obtained with three cassettes.
Fig. 8
Fig. 8
Emission profile (scan result) of 1ng haptenized DNA sample. The scan signal is depicted as a function of position along the strip.
Fig. 9
Fig. 9
The test (T, solid diamonds) and control (C, upright, solid triangles) signals’ areas are depicted as a function of the DNA concentration (ng).
Fig. 10
Fig. 10
The ratio of the test and the control signal areas of the haptenized PCR amplification as a function of DNA concentration. The error bars represent the scatter of data obtained with three cassettes.

References

    1. Wang J, Chen Z, Corstjens PLAM, Mauk MG, Bau HH. Lab Chip. 2006;6:46–53. - PubMed
    1. Srinivasan V, Pamula VK, Fair RB. Lab Chip. 2004;4:310–315. - PubMed
    1. Yager P, Edwards T, Fu E, Helton K, Nelson K, Tam MR, Weigl BH. Nature. 2006;442:412–418. - PubMed
    1. Chen X, Cui D, Liu C. Electrophoresis. 2008;29:1844–1851. - PubMed
    1. Garcia E, Kirkham JR, Hatch AV, Hawkins KR, Yager P. Lab Chip. 2004;4:78–82. - PubMed

Publication types