. 2009 Jun;10(2):205-19.
doi: 10.1007/s10162-009-0160-4. Epub 2009 Mar 3.

Trafficking of systemic fluorescent gentamicin into the cochlea and hair cells

Affiliations

Trafficking of systemic fluorescent gentamicin into the cochlea and hair cells

Qi Wang et al. J Assoc Res Otolaryngol. 2009 Jun.

Abstract

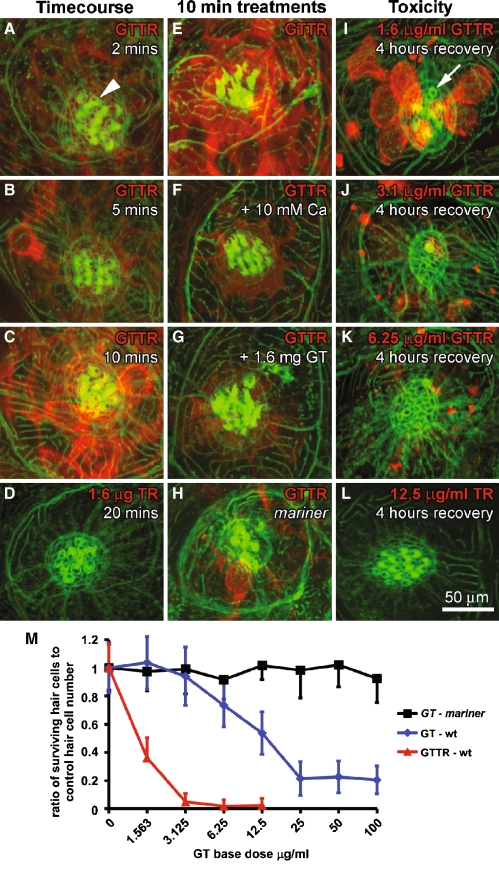
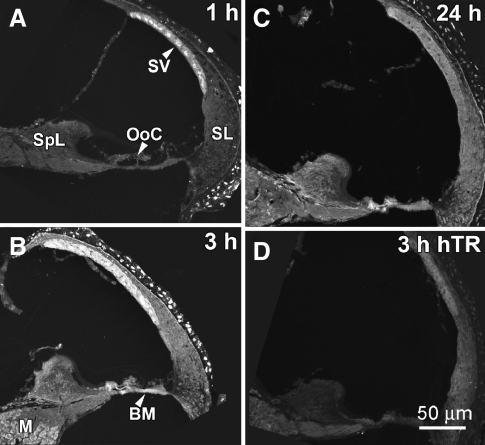
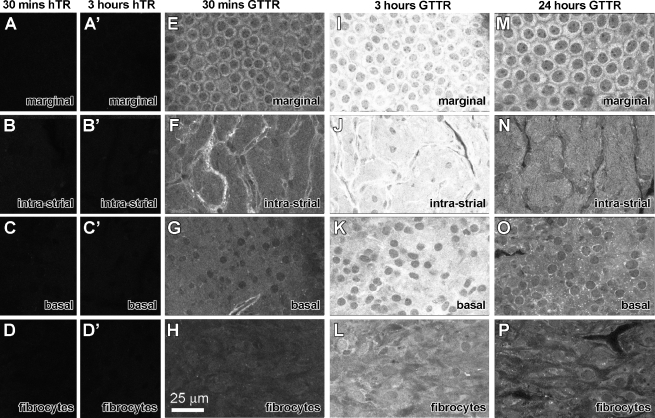
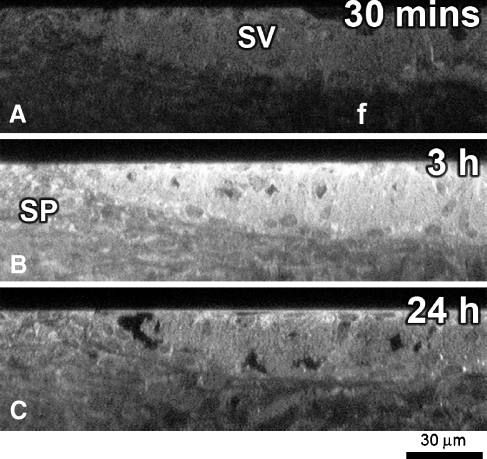
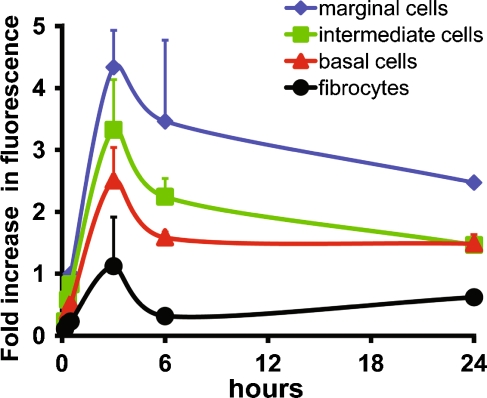
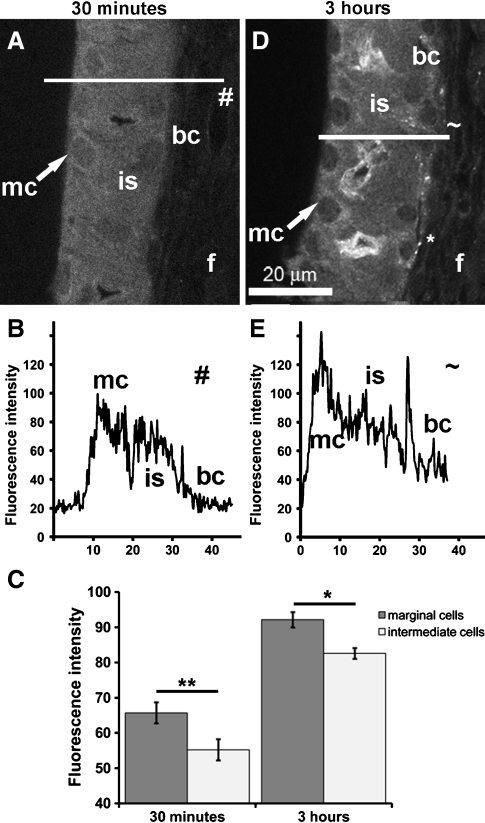
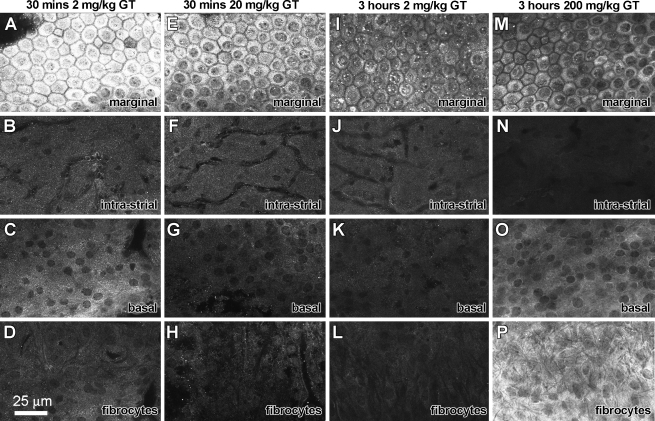
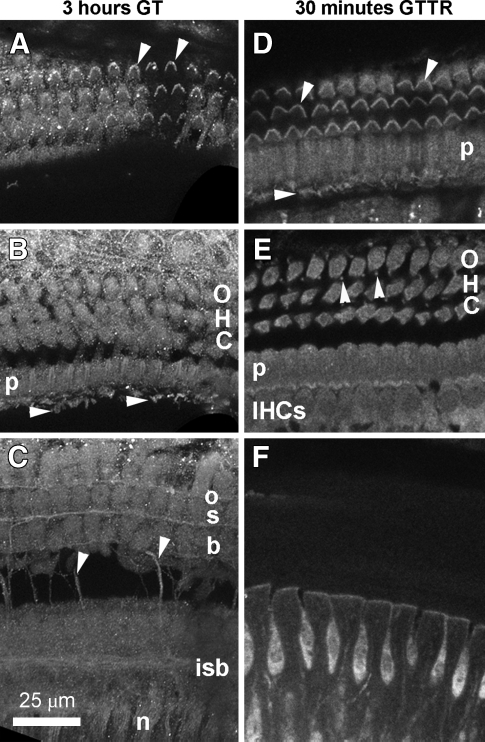
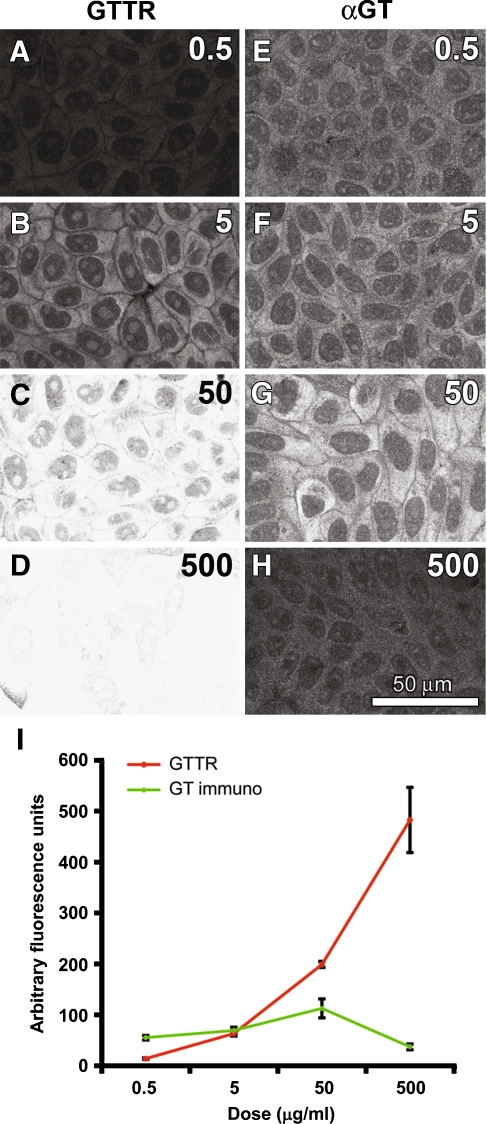
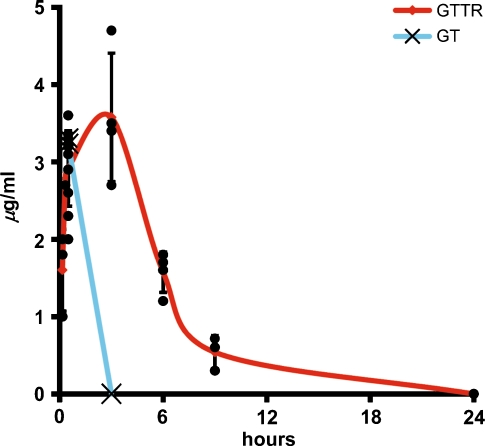
Aminoglycosides enter inner ear hair cells across their apical membranes via endocytosis, or through the mechanoelectrical transduction channels in vitro, suggesting that these drugs enter cochlear hair cells from endolymph to exert their cytotoxic effect. We used zebrafish to determine if fluorescently tagged gentamicin (GTTR) also enters hair cells via apically located calcium-sensitive cation channels and the cytotoxicity of GTTR to hair cells. We then examined the serum kinetics of GTTR following systemic injection in mice and which murine cochlear sites preferentially loaded with systemically administered GTTR over time by confocal microscopy. GTTR is taken up by, and is toxic to, wild-type zebrafish neuromast hair cells. Neuromast hair cell uptake of GTTR is attenuated by high concentrations of extracellular calcium or unconjugated gentamicin and is blocked in mariner mutant zebrafish, suggestive of entry via the apical mechanotransduction channel. In murine cochleae, GTTR is preferentially taken up by the stria vascularis compared to the spiral ligament, peaking 3 h after intra-peritoneal injection, following GTTR kinetics in serum. Strial marginal cells display greater intensity of GTTR fluorescence compared to intermediate and basal cells. Immunofluorescent detection of gentamicin in the cochlea also revealed widespread cellular labeling throughout the cochlea, with preferential labeling of marginal cells. Only GTTR fluorescence displayed increasing cytoplasmic intensity with increasing concentration, unlike the cytoplasmic intensity of fluorescence from immunolabeled gentamicin. These data suggest that systemically administered aminoglycosides are trafficked from strial capillaries into marginal cells and clear into endolymph. If so, this will facilitate electrophoretically driven aminoglycoside entry into hair cells from endolymph. Trans-strial trafficking of aminoglycosides from strial capillaries to marginal cells will be dependent on as-yet-unidentified mechanisms that convey these drugs across the intra-strial electrical barrier and into marginal cells.


Figures

FIG. 1.
FIG. 1.
GTTR enters zebrafish neuromast hair cells and is cytotoxic. AC Neuromast hair cells can be identified by phalloidin-labeled (green) cuticular plates (arrowhead). GTTR uptake (red) by hair cells is cumulative over time (2–10 min), and is preferentially localized within the cytoplasm. D Neuromast hair cells treated with the same dose of unconjugated Texas Red for 20 min display negligible Texas Red fluorescence. E Neuromast hair cells incubated with GTTR for 10 min display robust GTTR fluorescence. F Neuromasts treated with GTTR plus 10 mM Ca++ for 10 min display reduced GTTR fluorescence in hair cell somata compared to (E). G Neuromast treated with GTTR plus 1.6 mg GT for 10 min also display reduced GTTR fluorescence in hair cell somata compared to (E). H Mariner mutant zebrafish treated with GTTR for 10 min show reduced GTTR uptake in neuromast hair cells compared to (E). I After 1 h of treatment with GTTR (1.6 mg/ml) and 4 h recovery, GTTR fluorescence is present the cytoplasm of many surviving, but not all (arrow), hair cells. Increasing doses of GTTR decreased the number of surviving hair cells after 4 h of recovery (IK). L Unconjugated Texas Red at the highest dose (12.6 mg/ml) is not detected in hair cells and all hair cells survived treatment. M Increasing doses of GT and GTTR decreased the number (or ratio) of surviving hair cells in wild-type zebrafish neuromasts in a dose-dependent manner (n ≥ 15 neuromasts/dose; untreated age-matched fish provided the control hair cell number in each neuromast, 14 ± 2.7 SD; n = 82). Increasing doses of GT did not decrease the number of hair cells in neuromasts (n ≥ 11/dose) of mariner mutant zebrafish.
FIG. 2.
FIG. 2.
Cochlear uptake of GTTR in cryostat sections. A One hour after i.p. injection, intra-cochlear GTTR fluorescence was largely associated with the stria vascularis (SV). Less intense fluorescence could be observed in the spiral ligament (SL), spiral limbus (SpL), and organ of Corti (OoC). B After 3 h, increased fluorescence occurred in each of these locations, and also in the modiolus (M) and at the basilar membrane (BM). C After 24 h, GTTR fluorescence was diminished at all locations. D Three hours after i.p. injection of hydrolyzed Texas Red (hTR), only weak tissue fluorescence could be observed. All images are from upper basal coil. Images acquired and post-processed identically.
FIG. 3.
FIG. 3.
Strial uptake and clearance of GTTR. AD Thirty minutes after i.p. injection of hTR, negligible fluorescence is observed in the different focal planes of a whole-mounted lateral wall (Focal planes determined by corresponding Alexa-488-conjugated phalloidin-labeled image obtained during sequential imaging). A′D′ Three hours after i.p. injection of hTR, negligible fluorescence is observed in the different focal planes of a whole-mounted lateral wall. EH GTTR fluorescence in the cytoplasm of marginal cells delineating their nuclei (E), intra-strial tissues (F), basal cells (G), and very weakly in type I fibrocytes (H) 30 min after injection. Note the increased fluorescence in tissues surrounding the strial capillaries in F. IL Three hours after injection, increased GTTR fluorescence in the cytoplasm of marginal cells, with less intense GTTR fluorescence in intra-strial tissues, basal cells, and fibrocytes in the same focal series. MP Twenty-four hours after injection, decreased GTTR fluorescence in marginal cells (M), intra-strial tissues (N), basal cells (O) and in spiral ligament type 1 fibrocytes (P) compared to the 3-h time point. All tissues from basal coil of cochlea. Images acquired and post-processed identically.
FIG. 4.
FIG. 4.
GTTR fluorescence is more intense in strial cells. A Thirty minutes after injection, GTTR fluorescence is preferentially localized in the stria vascularis, compared to type I fibrocytes (f) in the spiral ligament. B Three hours after injection, increased GTTR fluorescence in the stria vascularis and spiral ligament. Note the increased fluorescence in the spiral prominence (SP) compared to type I fibrocytes radial to the stria vascularis (apparent at all time points). C Decreased GTTR fluorescence in lateral wall tissues 24 h after injection, compared to (B). Note the similarity of fluorescence between spiral prominence and stria vascularis and the comparatively reduced fluorescence in the region of type I fibrocytes. All tissues from basal coil. Images acquired and post-processed identically.
FIG. 5.
FIG. 5.
GTTR fluorescence is more intense in marginal cells. The fluorescent intensity of marginal cells (cytoplasm only), intra-strial tissues, basal cells, and type I fibrocytes at any given time point in xy optical sections ratioed against that of marginal cells at 30 min. Marginal cells were consistently more intensely labeled with GTTR than other cells. Intra-strial tissues and basal cells are also consistently more intense than type I fibrocytes. GTTR fluorescence generally decreased in intensity in all lateral wall tissues following the peak in fluorescence at 3 h. Note the similar intensity of GTTR fluorescence in basal cells and type 1 fibrocytes at 24 h compared to 6-h time point. All cells from basal coil images acquired and post-processed identically. Some error bars obscured by data symbols.
FIG. 6.
FIG. 6.
Marginal cells are brighter than intra-strial tissues. High resolution xy optical sections of strial cells and the spiral ligament whole-mounted end-on to give a “cross-sectioned” image. A GTTR fluorescence in marginal cells (mc) and intra-strial tissues (is), with markedly reduced fluorescence in basal cells (bc) and type 1 fibrocytes (f) 30 min after injection. B Plot profile of line # delineated in (A) showing different levels of GTTR in different strial layers. C Segmentation of cytoplasmic fluorescence in marginal and intra-strial tissues only (no capillary-associated fluorescence) reveals statistically greater GTTR fluorescence in marginal cells 30 min (data from two mice, four samples each; **p < 0.005) and 3 h (excluding strial capillary tissues; data from two mice, four samples each; *p < 0.05) after injection. D GTTR fluorescence in marginal cells (mc), and intra-strial tissues (is), with markedly increased fluorescence in basal cells (bc) and type 1 fibrocytes (f) 3 h after injection. E Plot profile of line ~delineated in (D) showing different levels of GTTR in different strial layers. All tissues from basal coil. Images acquired and post-processed identically.
FIG. 7.
FIG. 7.
GT immunofluorescence in the stria vascularis. A, E GT is intensely localized in marginal cells 30 min after a 2 mg/kg i.p. injection. The nucleoplasm of marginal cell nuclei displayed weak labeling, revealing unlabeled, nucleoli-like structures (A, E, I). Weak GT immunofluorescence occurred in intermediate cells (B, F, J, N), basal cells (C, G, K, O) and fibrocytes of the spiral ligament (D, H, L). Strial capillaries were not distinctly labeled in intra-strial tissues (B, F, J, N). P At high doses of GT administration (200 mg/kg) 3 h after i.p. injection, fibrocytes are more intensely labeled than marginal, intermediate or basal cells (MP). All tissues from basal coil. Images acquired and post-processed identically.
FIG. 8.
FIG. 8.
GT immunolabeling and GTTR in the organ of Corti. A Three hours after 2 mg/kg GT injection i.p., GT was immunolocalized in stereociliary bundles (arrowheads) and apices of outer hair cells (OHCs), and in the apices of adjacent pillar and Deiters’ cells. B The cell bodies of OHCs, pillar cells (p), the remaining supporting cells are labeled with approximately equal fluorescent intensity. IHC stereocilia (arrowheads) can also be visualized in this focal plane. C as are nerve fibers (n) proximal to the habenula, transverse (arrowheads), inner spiral bundle fibers (isb), and three rows of outer spiral bundles (osb). D Thirty minutes after GTTR injection i.p., GTTR fluorescence was localized in the hair bundles of both OHCs and IHCs (arrowheads and in the apices of pillar cells (p). E The cell bodies of OHCs, IHCs, pillar cells (p), the remaining supporting cells, including the Deiters’ cell phalangeal processes (arrowheads) are labeled with approximately equal fluorescent intensity. F The interdental cells of the spiral limbus also show GTTR fluorescence at this time point. All tissues from basal coil. Images acquired and post-processed identically.
FIG. 9.
FIG. 9.
GTTR fluorescence, but not GT immunofluorescence, increases in intensity with increasing dose. AD Increasing doses of GTTR increased the intensity of cytoplasmic GTTR fluorescence in MDCK cells. Diffuse GTTR fluorescence is localized in the cytoplasm, with discrete fluorescent intra-nuclear structures and trans-nuclear tubules also visible. EH Increasing doses of GT did not increase the intensity of GT immunofluorescence. At the highest concentration of GT, reduced GT immunofluorescence is observed (H). I The intensity of GTTR fluorescence is dose-dependent, but not GT immunofluorescence. (The ratio of fluorescence intensity between 50 and 500 mg/ml GTTR doses obtained at a lower laser power provided an estimate of the pixel intensity of saturated cytoplasmic regions at the 500 mg/ml GTTR dose for this data series.) Images acquired and post-processed identically.
FIG. 10.
FIG. 10.
GTTR serum kinetics are slower than for GT. Following i.p. injection, GTTR reached serum levels of 2.9 ± 0.48 mg/ml within 30 min. Serum levels of GTTR peaked at 3 h (3.5 ± 0.48 mg/ml), before falling with a half-life of 130 min. For GT, serum concentrations were 3.2 ± 0.05 mg/ml after 30 min and were undetectable after 3 h (half-life ~ 56 min).

Similar articles

Cited by

References

    1. {'text': '', 'ref_index': 1, 'ids': [{'type': 'DOI', 'value': '10.1111/j.1749-6632.1999.tb08636.x', 'is_inner': False, 'url': 'https://doi.org/10.1111/j.1749-6632.1999.tb08636.x'}, {'type': 'PubMed', 'value': '10842584', 'is_inner': True, 'url': 'https://pubmed.ncbi.nlm.nih.gov/10842584/'}]}
    2. Aran JM, Erre JP, Lima da Costa D, Debbarh I, Dulon D. Acute and chronic effects of aminoglycosides on cochlear hair cells. Ann N Y Acad Sci 884:60–8, 1999. - PubMed
    1. {'text': '', 'ref_index': 1, 'ids': [{'type': 'PubMed', 'value': '4193456', 'is_inner': True, 'url': 'https://pubmed.ncbi.nlm.nih.gov/4193456/'}]}
    2. Balogh K, Jr, Hiraide F, Ishii D. Distribution of radioactive dihydrostreptomycin in the cochlea. An autoradiographic study. Ann. Otol. Rhinol. Laryngol 79:641–52, 1970. - PubMed
    1. {'text': '', 'ref_index': 1, 'ids': [{'type': 'DOI', 'value': '10.1007/BF00495788', 'is_inner': False, 'url': 'https://doi.org/10.1007/bf00495788'}, {'type': 'PubMed', 'value': '3011710', 'is_inner': True, 'url': 'https://pubmed.ncbi.nlm.nih.gov/3011710/'}]}
    2. Bareggi R, Narducci P, Grill V, Mallardi F, Zweyer M, Fusaroli P. Localization of an aminoglycoside (streptomycin) in the inner ear after its systemic administration. A histochemical study using fluorescence microscopy. Histochemistry 84:237–40, 1986. - PubMed
    1. {'text': '', 'ref_index': 1, 'ids': [{'type': 'PubMed', 'value': '659353', 'is_inner': True, 'url': 'https://pubmed.ncbi.nlm.nih.gov/659353/'}]}
    2. Brummett RE, Fox KE, Bendrick TW, Himes DL. Ototoxicity of tobramycin, gentamicin, amikacin and sisomicin in the guinea pig. J. Antimicrob. Chemother 4(Suppl A):73–83, 1978. - PubMed
    1. {'text': '', 'ref_index': 1, 'ids': [{'type': 'PubMed', 'value': '16805980', 'is_inner': True, 'url': 'https://pubmed.ncbi.nlm.nih.gov/16805980/'}]}
    2. Chu HQ, Xiong H, Zhou XQ, Han F, Wu ZG, Zhang P, Huang XW, Cui YH. Aminoglycoside ototoxicity in three murine strains and effects on NKCC1 of stria vascularis. Chin. Med. J. (Engl) 119:980–5, 2006. - PubMed

Publication types

MeSH terms