. 2009 Jan;79(1 Pt 1):011914.
doi: 10.1103/PhysRevE.79.011914. Epub 2009 Jan 21.

Noise shaping in neural populations

Affiliations

Noise shaping in neural populations

Oscar Avila Akerberg et al. Phys Rev E Stat Nonlin Soft Matter Phys. 2009 Jan.

Abstract

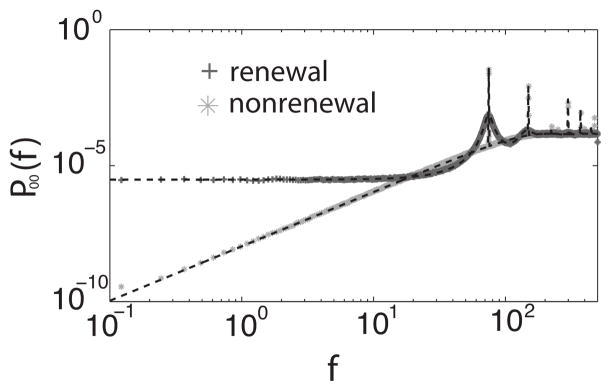
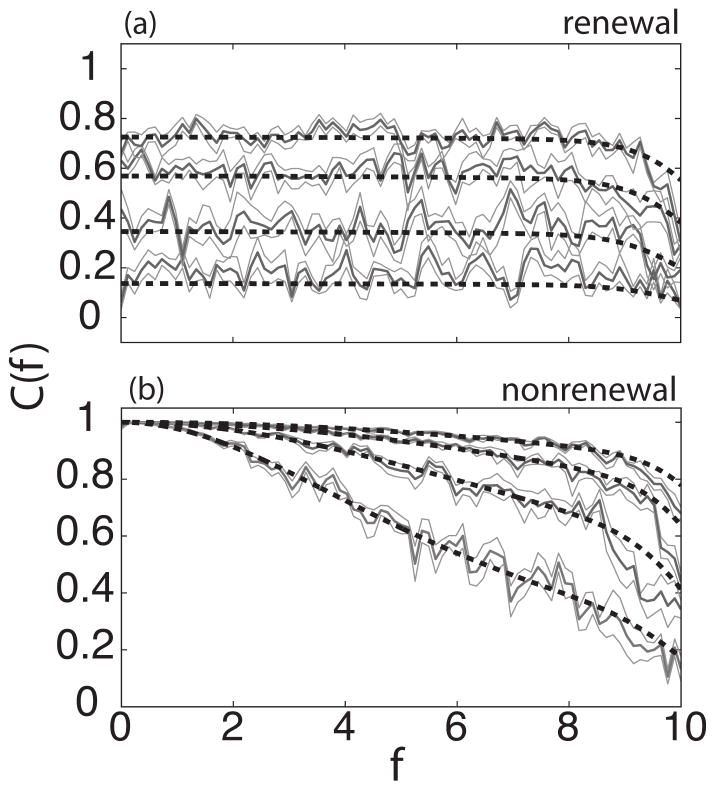
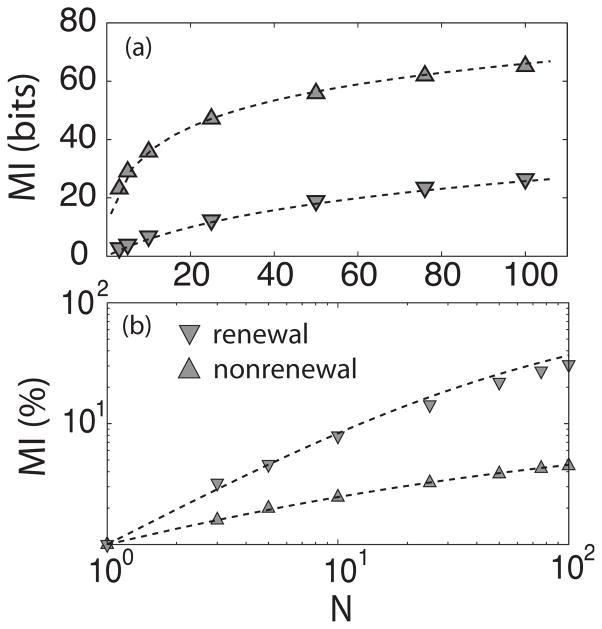
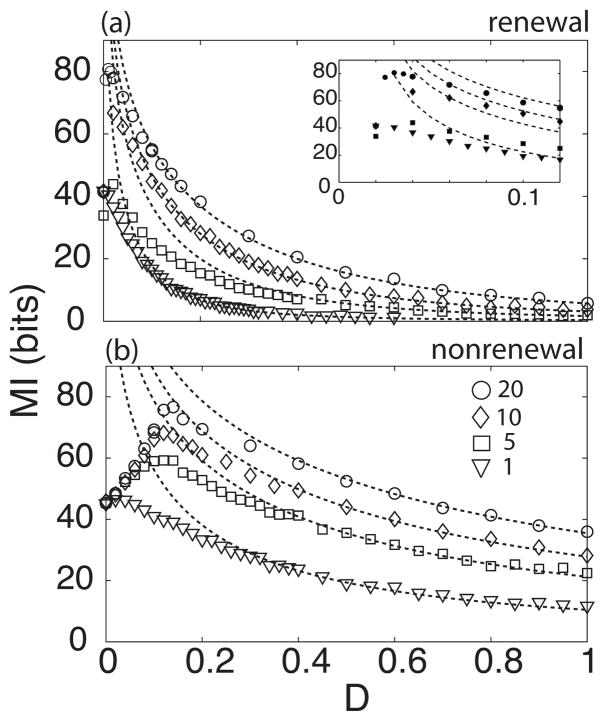
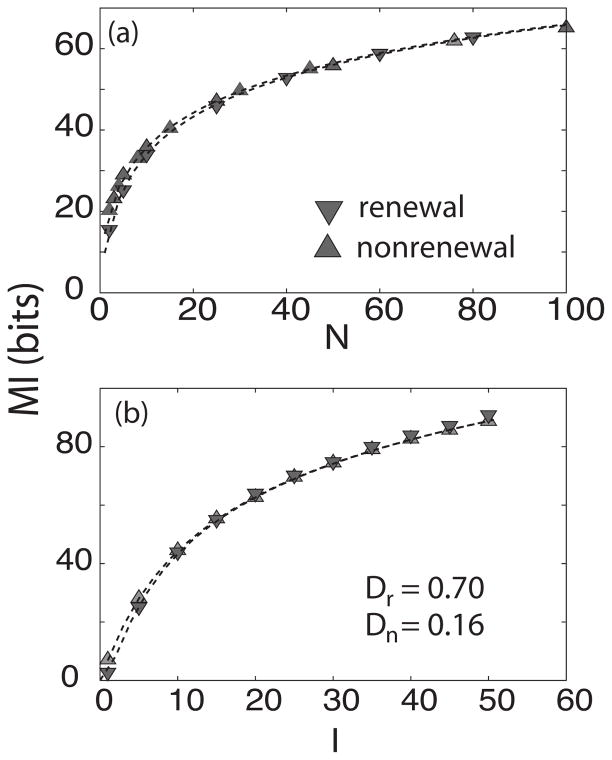
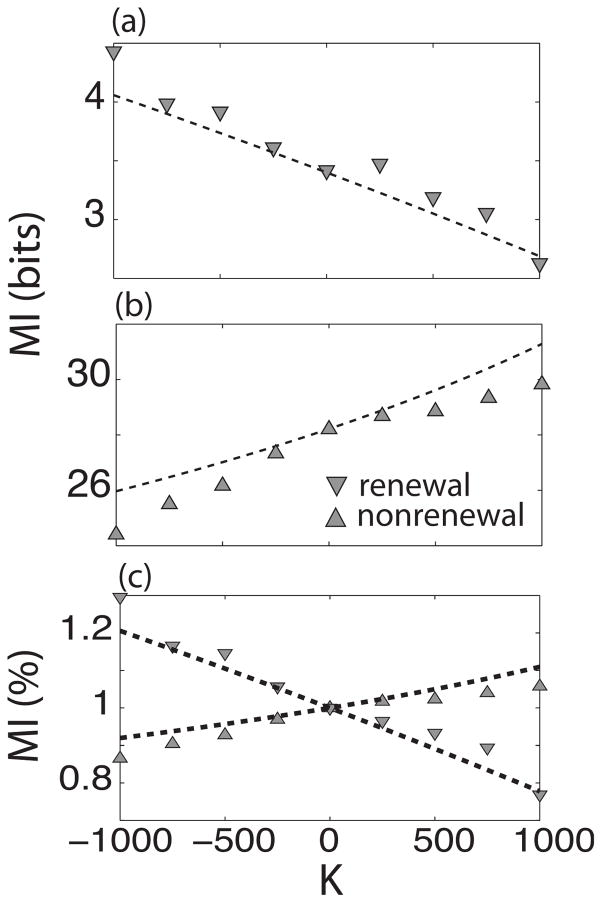
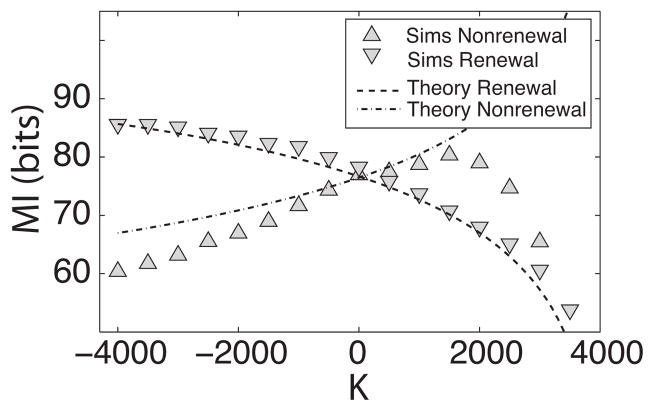
Many neurons display intrinsic interspike interval correlations in their spike trains. However, the effects of such correlations on information transmission in neural populations are not well understood. We quantified signal processing using linear response theory supported by numerical simulations in networks composed of two different models: One model generates a renewal process where interspike intervals are not correlated while the other generates a nonrenewal process where subsequent interspike intervals are negatively correlated. Our results show that the fractional rate of increase in information rate as a function of network size and stimulus intensity is lower for the nonrenewal model than for the renewal one. We show that this is mostly due to the lower amount of effective noise in the nonrenewal model. We also show the surprising result that coupling has opposite effects in renewal and nonrenewal networks: Excitatory (inhibitory coupling) will decrease (increase) the information rate in renewal networks while inhibitory (excitatory coupling) will decrease (increase) the information rate in nonrenewal networks. We discuss these results and their applicability to other classes of excitable systems.


Figures

FIG. 1
FIG. 1
Power spectrum of the baseline of a single renewal and nonrenewal neuron. Numerical simulations are represented with the symbols and were averaged between 50 trials. The theoretical value is represented as a black dashed line. The parameters used were μ =290, θ0 =4, d =0.7.
FIG. 2
FIG. 2
Coherence C(f) as function of frequency f for different values of the network size N with renewal (a) and nonrenewal (b) neurons. In both panels the number of neurons from bottom to top: 3,10,25,50 neurons. Solid color shows simulation and dashed line the theory. Dark gray represents the mean from ten trials surrounded in light gray by the standard error. The parameter values are as follows: θ0 =4, d =0.7, τs =0.001, fC =10, μ=290, I=5, K=0.
FIG. 3
FIG. 3
Mutual information as a function of the number of neurons in the network. In (a) both models are shown together, nonrenewal (triangles up) and renewal (triangles down) neurons. The triangles represent the simulations and dashed line the theoretical results. The standard error is less than the height of the triangles. The plots in (b) show MI for each of the models normalized to the value of MI for one neuron. Parameter values are the same as in Fig. 2.
FIG. 4
FIG. 4
Mutual information as a function of noise intensity D for renewal (a) and nonrenewal (b) networks for different network sizes. From top to bottom we used N=20, 10, 5, and 1. Symbols represent simulations and dashed lines theoretical values. Inset shows the MI for D between 0 to 0.1 to better show the MI peaks for different values of N.
FIG. 5
FIG. 5
Renewal and nonrenewal models behave similarly for different values of the noise intensity D. Mutual information rate MI as a function of network size N(a) and stimulus intensity I(b) Here Dn =0.7, Dr =0.158 while other parameters have the same value as in Fig. 4. Up and down triangles represent simulations for nonrenewal and renewal networks, respectively, and the dashed lines the theoretical values.
FIG. 6
FIG. 6
Mutual information as a function of coupling strength K of renewal (a) and nonrenewal (b) networks. The triangles represent the simulations and the dashed line the theoretical values. (c) Shows MI normalized to the value of coupling at K=0. A clear qualitative difference can be seen for both models.
FIG. 7
FIG. 7
Mutual information rate as a function of coupling strength for renewal and nonrenewal models with different noise intensities. Here we set N=20, I=40, Dr=0.4, Dn=1.78 with other parameters having the same value as in Fig. 6.
FIG. 8
FIG. 8
Power spectrum of a single renewal (a) and nonrenewal (b) neuron as a function of stationary firing rate. Symbols represent numerical simulations. Crosses represents r0=25, circles r0=75, and diamonds r0=125. Dashed lines represent the theoretical values accordingly. Other parameters of the single neuron are the same as in Fig. 1.
FIG. 9
FIG. 9
First and second coefficients of the Taylor expansion of the power spectra P00A and P00B. Both second order terms decrease as μ increases while the zeroth-order term is nonzero only for model B and increases linearly with μ. Here θ0=4, D=0.7, and μ =290.

Similar articles

Cited by

References

    1. Yacomotti AM, Eguia MC, Aliaga J, Martinez OE, Mindlin GB, Lipsich A. Phys Rev Lett. 1999;83:292.
    2. Wiesenfeld K, Satija I. Phys Rev B. 1987;36:2483. - PubMed
    1. Mainen ZF, Sejnowski TJ. Science. 1995;2681503 - PubMed
    1. Bulsara A, et al. J Stat Phys. 1993;70(1)
    2. Gammaitoni L, et al. Rev Mod Phys. 1998;70:223.
    3. Moss F, Ward L, Sannita W. Clin Neurophysiol. 2004;115:267. - PubMed
    1. Izhikevich EM. Int J Bifurcation Chaos Appl Sci Eng. 2000;10:1171.
    2. Sherman SM. Trends Neurosci. 2001;24:122. - PubMed
    1. Gray C, Singer W. Proc Natl Acad Sci USA. 1989;86:1698. - PMC - PubMed
    2. Sillito AM, et al. Nature (London) 1994;369:479. - PubMed
    3. MacLeod K, Laurent G. Science. 1996;274:976. - PubMed
    4. Kashiwadani H, et al. J Neurophysiol. 1999;82:1786. - PubMed
    5. Stopfer M, et al. Nature (London) 1997;390:70. - PubMed

Publication types

LinkOut - more resources