. 2009 Jun;21(6):978-85.
doi: 10.1016/j.cellsig.2009.02.019. Epub 2009 Mar 1.

Glycogen synthase kinase-3 promotes the synergistic action of interferon-gamma on lipopolysaccharide-induced IL-6 production in RAW264.7 cells

Affiliations

Glycogen synthase kinase-3 promotes the synergistic action of interferon-gamma on lipopolysaccharide-induced IL-6 production in RAW264.7 cells

Eléonore Beurel et al. Cell Signal. 2009 Jun.

Abstract

Macrophages are the major effector cells of the innate immune system. Their function requires the integration of signals from pathogens, such as those induced by lipopolysaccharide (LPS), and from the host, such as those induced by interferon-gamma (IFN-gamma). The priming by IFN-gamma of Toll-like receptor-induced macrophage activation has long been recognized, but the mechanisms underlying this priming action remain unclear. We report in this study that the priming of macrophage-derived RAW264.7 cells by IFN-gamma is highly dependent on glycogen synthase kinase-3 (GSK3). Cooperative interactions of GSK3 and signal transducer and activator of transcription-3 (STAT3) were revealed by the findings that GSK3 inhibitors, or knockdown of the GSK3 beta isoform, strongly reduced the activation of STAT3, but not STAT1, induced by IFN-gamma without affecting upstream signaling events, and GSK3 was associated with STAT3. Direct inhibition of STAT3 activation abolished the synergistic action of IL-6 production by IFN-gamma administered with LPS. Similarly, inhibition of GSK3 abolished the synergistic stimulation of IFN-gamma on IL-6 production, and GSK3 was recruited to the IFN-gamma receptor by co-treatment with IFN-gamma and LPS. These results demonstrate the dependency of macrophage priming by IFN-gamma on STAT3 and GSK3, providing novel targets for intervention.


Figures

FIGURE 1
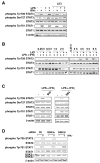
FIGURE 1. IFNγ activates STAT1 and STAT3
RAW264.7 cells were treated with 1 ng/mL IFNγ, 100 ng/mL LPS, or both, for 15 min to 4 h and cell lysates were immunoblotted for phospho-Tyr701-STAT1, phospho-Tyr705-STAT3, and total STAT1 and STAT3 (n=3).
FIGURE 2
FIGURE 2. GSK3 regulates STAT3 tyrosine-705 phosphorylation
(A) RAW264.7 cells were treated with 100 ng/mL LPS, 1 ng/mL IFNγ, or both, in the absence or presence of 20 mM lithium (LiCl) for 30 min, followed by analysis of cell lysates by immunoblotting with phosphorylation-specific antibodies to assess the phosphorylation of STAT3 (Tyr705, Ser727) and STAT1 (Tyr701) (n=4). (B) Kinetics of inhibition of phospho-Tyr705-STAT3 by 20 mM lithium in RAW264.7 cells (n=3). (C) RAW264.7 cells were treated with 100 ng/mL LPS and 1 ng/mL IFNγ, without or with the GSK3 inhibitors 10 μM bromoindirubin-3′-oxime (BIO) or 10 μM SB415286, for 30 min and cell lysates were analyzed by immunoblotting (n=3). (D) The level and phosphorylation of STAT3 (Tyr705) and STAT1 (Tyr701) were assessed after 48 h siRNA-mediated knockdown of GSK3α or GSK3β and stimulation with IFNγ (1 ng/mL) for 30 min (n=3).
FIGURE 3
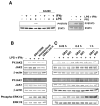
FIGURE 3. Modulation of signaling induced by stimulation with LPS and IFNγ
RAW264.7 cells were stimulated with 1 ng/mL IFNγ, 100 ng/mL LPS, or both. (A) JAK was inhibited by treatment with 100 μM AG490 for 6 h (left panels) and Src was inhibited with 10 μM PP2 for 30 min (right panels) and cell lysates were immunoblotted for phospho-Tyr705-STAT3 and total STAT3 (n=3). (B) GSK3 was inhibited by treatment with the indicated selective GSK3 inhibitors (10 μM) and cell lysates were immunoblotted for phospho-Tyr1007/1008-JAK2, total JAK2, phospho-Tyr1022/1023-JAK1, total JAK1, phospho-ERK1/2 (p44 and p42), and total ERK1/2 (n=4). Immunoblots were reblotted with β-actin to ensure equal protein loading. (C) RAW264.7 cells were treated for 15, 30 min or 1 h without or with the indicated selective GSK3 inhibitors 10 μM bromoindirubin-3′-oxime (BIO) or 10 μM SB216763 and cell lysates were immunoblotted as in (B) (n=2).
FIGURE 4
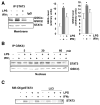
FIGURE 4. STAT3 is regulated by GSK3
(A) RAW264.7 cells were ithtreated 100 w ng/mL LPS, 1 ng/mL IFNγ, or both, for 5 min, membrane fractions were prepared for immunoprecipitation of STAT3, and immunoprecipitants were immunoblotted for GSK3α/β and STAT3. To ensure the specificity of the immunoprecipitation, an immunoprecipitation with a non-specific isotypic IgG was included as a control. Quantified levels of GSK3α and GSK3β are shown on the right and values represent the mean ± SEM.; n=3 *p<0.05 compared to controls (Mann Whitney test). (B) RAW264.7 cells were treated with 100 ng/mL LPS, 1 ng/mL IFNγ, or both, for 5, 30, or 60 min and GSK3β was immunoprecipitated from nuclear fractions, and immunoprecipitants were immunoblotted for GSK3β and STAT3. (C) STAT3 DNA binding activity was measured in RAW264.7 cells after stimulation with 100 ng/mL LPS, 1 ng/mL IFNγ, or both for 30 min, with or without a 30 min pretreatment with 20 mM lithium. STAT3 immunoprecipitated with SIE-oligoSTAT3 beads was visualized by immunoblotting (n=3).
FIGURE 5
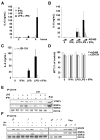
FIGURE 5. STAT3 is required for the synergistic action of IFNγ
(A) IL-6 production was measured using RAW264.7 cells treated with 1 ng/mL IFNγ, 100 ng/mL LPS, or both, for 2 to 6 h. IL-6 in cell-free supernatants was analyzed by ELISA (n=3, *p <0.05 compared to control, Wilcoxon test). RAW264.7 cells were treated with 1 ng/mL IFNγ, 100 ng/mL LPS, or both, for 6 h and IL-6 in cell-free supernatants was analyzed by ELISA after: (B) inhibition of JAK by treatment with 30 or 100 μM AG490 for 6 h (n=5, *p < 0.05 compared to samples treated with LPS plus IFNγ, Mann Whitney test), (C) Inhibition of STAT3 activation by treatment with 10 μM JSI-124 for 6 h (n=7, *p < 0.05 compared to samples treated with LPS plus IFNγ, Mann Whitney test). (D) Cell viability of RAW264.7 cells treated with 1 ng/mL IFNγ, 100 ng/mL LPS, or both, without or with 100 μM AG490 or 10 μM JSI-124 for 6 h (n=3). Values represent mean ± SEM. (E) CD119 was immunoprecipitated from membrane fractions prepared from RAW264.7 cells treated for 30 min with 1 ng/mL IFNγ, 100 ng/mL LPS, or both, without or with treatment with 20 mM lithium, and immunoprecipitants were immunoblotted for GSK3α/β and STAT3 (n=4). To confirm the efficiency of the immunoprecipitation, the supernatant (Sup) was immunoblotted after immunoprecipitation. (F) After 48 h siRNA-mediated knockdown of GSK3α or GSK3β, or incubation with a control siRNA (Ctl), RAW264.7 cells were treated for 30 min with 100 ng/mL LPS, 1 ng/mL IFNγ, or both. CD119 was immunoprecipitated, and immunoprecipitants were immunoblotted for GSK3α/β and STAT3.
FIGURE 6
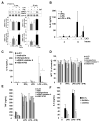
FIGURE 6. GSK3 controls the synergistic action of IFNγ on LPS-induced IL-6 production
(A) The IFNγ receptor α-chain (CD119) was immunoprecipitated from membrane fractions prepared from RAW264.7 cells after 5 or 30 min treatment with 1 ng/mL IFNγ, 100 ng/mL LPS, or both, and immunoprecipitants were immunoblotted for GSK3α/β. (n=3). To ensure the specificity of the immunoprecipitation, an immunoprecipitation with a non-specific isotypic IgG was included as a control. Quantified levels of GSK3α and GSK3β are shown on the bottom and values represent the mean ± SEM.; n=3 *p<0.05 compared to controls (Mann Whitney test). (B) IL-6 production was measured using RAW264.7 cells treated with 1 ng/mL IFNγ, 100 ng/mL LPS, or both, without or with 20 mM lithium treatment for 4 or 6 h. (n=3; *p < 0.05 compared to samples treated with LPS plus IFNγ without lithium, Mann Whitney test). (C) IL-6 production was measured using RAW264.7 cells treated with 1 ng/mL IFNγ, 100 ng/mL LPS, or both, without or with 10 μM GSK3 inhibitors (indirubin-3′-monoxime, kenpaullone, GSK3 inhibitor II and SB216763) for 6 h. (n=5; *p < 0.05 compared to samples treated with LPS plus IFNγ without GSK3 inhibitor, Mann Whitney test). (D) Cell viability of RAW264.7 cells treated with 1 ng/mL IFNγ, 100 ng/mL LPS, or both, without or with 20 mM lithium or 10 μM other GSK3 inhibitors (bromoindirubin-3′-monoxime (BIO), kenpaullone, GSK3 inhibitor II and SB216763). (E) TNF production was measured using RAW264.7 cells treated with 1 ng/mL IFNγ, 100 ng/mL LPS, or both, without or with 20 mM lithium or 10 μM other GSK3 inhibitors (bromoindirubin-3′-monoxime, kenpaullone, GSK3 inhibitor II and SB216763) for 6 h. TNF in cell-free supernatants was analyzed by ELISA (n=3). (F) IL-6 production by RAW264.7 cells after 48 h siRNA-mediated knockdown of GSK3α or GSK3β and stimulation with LPS (100 ng/mL) alone or with IFNγ (1 ng/mL) for 6 h (n=3, *p<0.05 compared to corresponding control siRNA values, Mann Whitney test). Values represent mean ± SEM.

References

    1. Janeway CA, Jr, Medzhitov R. Annu Rev Immunol. 2002;20:197. - PubMed
    1. Kawai T, Adachi O, Ogawa T, Takeda K, Akira S. Immunity. 1999;11:115. - PubMed
    1. Hoebe K, Du X, Georgel P, Janssen E, Tabeta K, Kim SO, Goode J, Lin P, Mann N, Mudd S, Crozat K, Sovath S, Han J, Beutler B. Nature. 2003;424:743. - PubMed
    1. Levy DE, Darnell JE., Jr Nat Rev Mol Cell Biol. 2002;3:651. - PubMed
    1. Schroder K, Hertzog PJ, Ravasi T, Hume DA. J Leukoc Biol. 2004;75:163. - PubMed

Publication types

MeSH terms