

Diel changes in nitrogen and carbon resource status and use for growth in young plants of tomato (Solanum lycopersicum)
- PMID: 19258341
- PMCID: PMC2707904
- DOI: 10.1093/aob/mcp043
Diel changes in nitrogen and carbon resource status and use for growth in young plants of tomato (Solanum lycopersicum)
Abstract
Background and aims: Modellers often define growth as the development of plant structures from endogenous resources, thus making a distinction between structural (W(S)) and total (W) dry biomass, the latter being the sum of W(S) and the weight of storage compounds. In this study, short-term C and N reserves were characterized experimentally (forms, organ distribution, time changes) in relation to light and nutrition signals, and organ structural growth in response to reserve levels was evaluated.
Methods: Tomato plants (Solanum lycopersicum) were grown hydroponically in a growth room with a 12-h photoperiod and an adequate supply of NO(3)(-) (3 mol m(-3)). Three experiments were carried out 18 d after sowing: [NO(3)(-)] was either maintained at 3 mol m(-3), changed to 0.02 mol m(-3) or to 0 mol m(-3). Plants were sampled periodically throughout the light/dark cycles over 24-48 h. Organ W(S) was calculated from W together with the amount of different compounds that act as C and N resources, i.e. non-structural carbohydrates and carboxylates, nitrate and free amino acids.
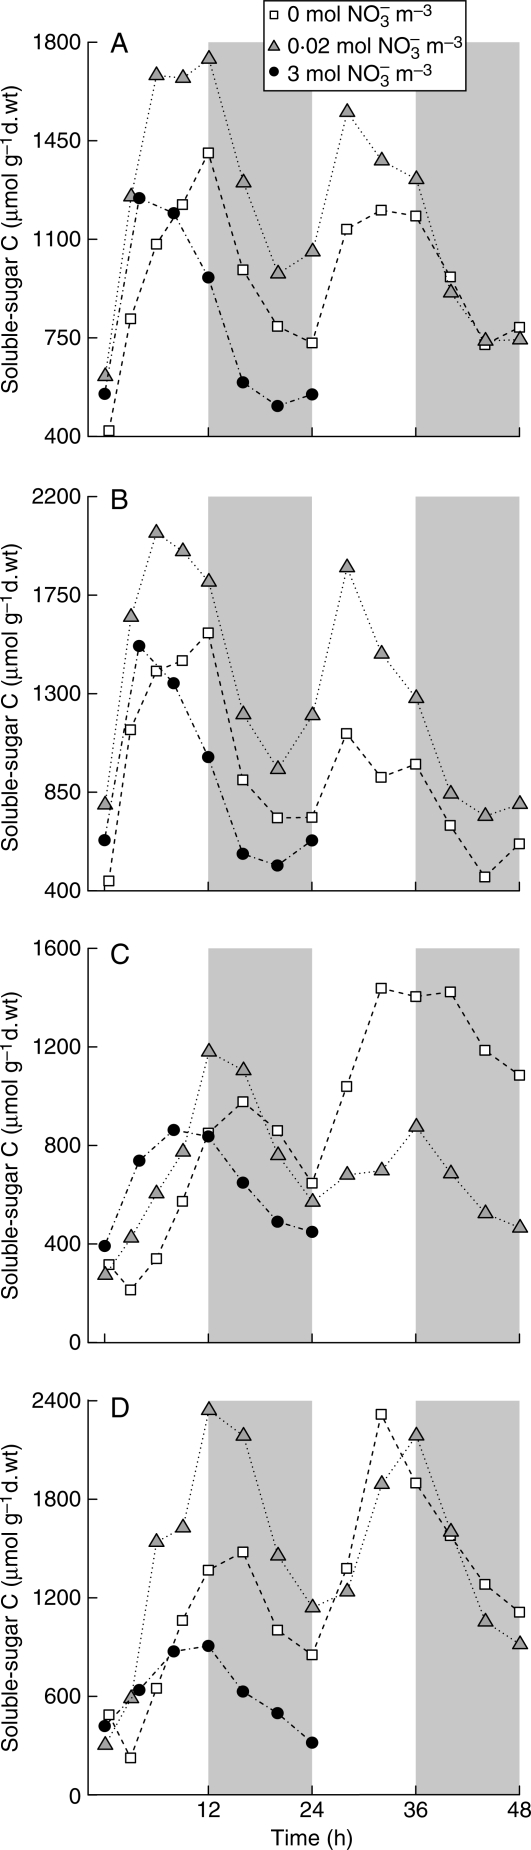
Key results: With adequate nutrition, carbohydrates accumulated in leaves during light periods, when photosynthesis exceeded growth needs, but decreased at night when these sugars are the main source of C for growth. At the end of the night, carbohydrates were still high enough to fuel full-rate growth, as W(S) increased at a near constant rate throughout the light/dark cycle. When nitrate levels were restricted, C reserves increased, but [NO(3)(-)] decreased progressively in stems, which contain most of the plant N reserves, and rapidly in leaves and roots. This resulted in a rapid restriction of structural growth.
Conclusions: Periodic darkness did not restrict growth because sufficient carbohydrate reserves accumulated during the light period. Structural growth, however, was very responsive to NO(3)(-) nutrition, because N reserves were mostly located in stems, which have limited nitrate reduction capacity.
Figures


Similar articles
-
Altering young tomato plant growth by nitrate and CO2 preserves the proportionate relation linking long-term organic-nitrogen accumulation to intercepted radiation.New Phytol. 2008;180(3):663-672. doi: 10.1111/j.1469-8137.2008.02605.x. Epub 2008 Aug 22. New Phytol. 2008. PMID: 18761639
-
Time-course of tomato whole-plant respiration and fruit and stem growth during prolonged darkness in relation to carbohydrate reserves.Ann Bot. 2003 Mar;91(4):429-38. doi: 10.1093/aob/mcg037. Ann Bot. 2003. PMID: 12588722 Free PMC article.
-
Is the C:N ratio a reliable indicator of C allocation to primary and defence-related metabolisms in tomato?Phytochemistry. 2013 Apr;88:25-33. doi: 10.1016/j.phytochem.2012.12.003. Epub 2013 Jan 9. Phytochemistry. 2013. PMID: 23312460
-
Growth of tobacco in short-day conditions leads to high starch, low sugars, altered diurnal changes in the Nia transcript and low nitrate reductase activity, and inhibition of amino acid synthesis.Planta. 1998 Dec;207(1):27-41. doi: 10.1007/s004250050452. Planta. 1998. PMID: 9951717
-
N uptake and distribution in crops: an agronomical and ecophysiological perspective.J Exp Bot. 2002 Apr;53(370):789-99. doi: 10.1093/jexbot/53.370.789. J Exp Bot. 2002. PMID: 11912222 Review.
Cited by
-
Rooting ability of rice seedlings increases with higher soluble sugar content from exposure to light.PLoS One. 2020 Oct 20;15(10):e0241060. doi: 10.1371/journal.pone.0241060. eCollection 2020. PLoS One. 2020. PMID: 33079962 Free PMC article.
-
Totomatix: a novel automatic set-up to control diurnal, diel and long-term plant nitrate nutrition.Ann Bot. 2012 Jan;109(1):309-19. doi: 10.1093/aob/mcr254. Epub 2011 Oct 10. Ann Bot. 2012. PMID: 21985796 Free PMC article.
-
Importance of the leaf respiratory quotient.Physiol Plant. 2025 Mar-Apr;177(2):e70235. doi: 10.1111/ppl.70235. Physiol Plant. 2025. PMID: 40259516 Free PMC article.
References
-
- Adamowicz S, Le Bot J. Altering young tomato plant growth by NO3 and CO2 preserves the proportionate relation linking long-term organic-N accumulation to intercepted radiation. New Phytologist. 2008;180:663–672. - PubMed
-
- Andrews M, Sutherland JM, Thomas RJ, Sprent JI. Distribution of nitrate reductase activity in six legumes: the importance of the stem. New Phytologist. 1984;98:301–310.
-
- Ball RA, Sabbe WE, DeLong RE. Starch and nitrogen status in soybean during shading and nutrient deficiency. Journal of Plant Nutrition. 1998;21:665–685.
-
- Ben Zioni A, Vaadia Y, Lips SH. Nitrate uptake by roots as regulated by nitrate reduction products of the shoot. Physiologia Plantarum. 1971;24:288–290.
-
- Bijlsma RJ, Lambers H. A dynamic whole-plant model of integrated metabolism of nitrogen and carbon. 2. Balanced growth driven by C fluxes and regulated by signals from C and N substrate. Plant and Soil. 2000;220:71–87.
