. 2009 Mar 24;106(12):4596-600.
doi: 10.1073/pnas.0812481106. Epub 2009 Mar 3.

Evidence for liquid water during the high-density to low-density amorphous ice transition

Affiliations

Evidence for liquid water during the high-density to low-density amorphous ice transition

Chae Un Kim et al. Proc Natl Acad Sci U S A. .

Abstract

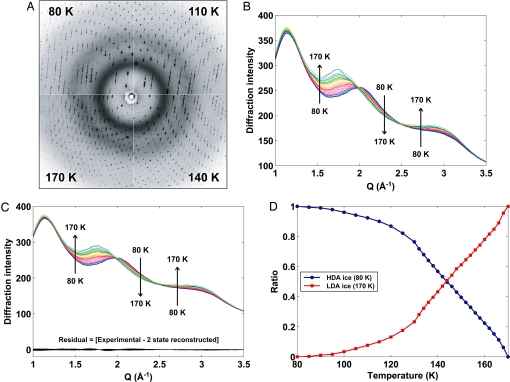
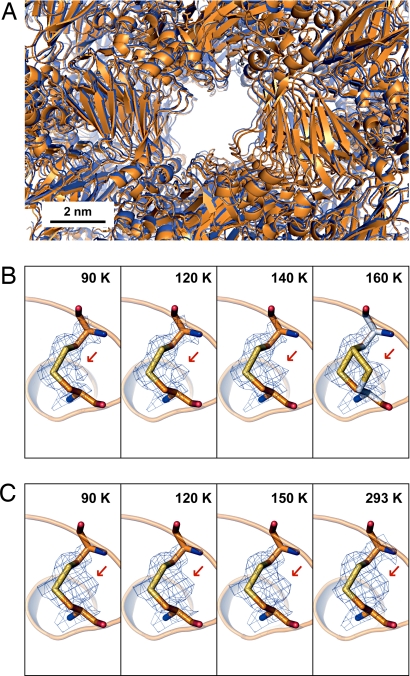
Polymorphism of water has been extensively studied, but controversy still exists over the phase transition between high-density amorphous (HDA) and low-density amorphous (LDA) ice. We report the phase behavior of HDA ice inside high-pressure cryocooled protein crystals. Using X-ray diffraction, we demonstrate that the intermediate states in the temperature range from 80 to 170 K can be reconstructed as a linear combination of HDA and LDA ice, suggesting a first-order transition. We found evidence for a liquid state of water during the ice transition based on the protein crystallographic data. These observations open the possibility that the HDA ice induced by high-pressure cryocooling is a genuine glassy form of high-density liquid.


Conflict of interest statement

The authors declare no conflict of interest.

Figures

Fig. 1.
Fig. 1.
Thaumatin diffraction of a crystal high-pressure cryocooled at 200 MPa. (A) Bragg and diffuse diffraction shown at 80, 110, 140, and 170 K. The primary WDD peak (second innermost ring) at Q = 2.03 Å−1 indicates HDA ice at 80 K and shifts to 2.00 Å−1 at 110 K, 1.92 Å−1 at 140 K, and finally to 1.73 Å−1, indicative of LDA ice at 170 K. The inner diffuse ring (Q = 1.2 Å−1) is from an oil coating applied to the crystal. (B) Radially integrated WDD profiles from crystal diffraction images. The 31 superimposed WDD profiles from 80 to 170 K show isosbestic points at Q = 2.0 and 2.5 Å−1. (C) WDD profiles reconstructed from 2 states via SVD analysis. Residuals were calculated by subtracting the reconstructed profile from the experimental WDD profile at each temperature. (D) Ratio of HDA ice at 80 K and LDA ice at 170 K used to reconstruct the transition WDD states between 80 and 170 K in the SVD analysis.
Fig. 2.
Fig. 2.
Parameters from protein crystals warmed from 80 to 170 K. (A and B) Thaumatin crystal high-pressure cryocooled at 200 MPa (A) and cryocooled at ambient pressure (0.1 MPa) (B). (C and D) Glucose isomerase crystal high-pressure cryocooled at 180 MPa (C) and elastase crystal high-pressure cryocooled at 200 MPa (D). Relative changes of the primary WDD peak position (blue, circle) in d-spacing (d = 2 π/Q), crystal unit-cell volume (green, square), and crystal mosaicity (red, diamond) are shown. The values for WDD peak position and unit-cell volume are multiplied by 10.
Fig. 3.
Fig. 3.
Crystal solvent channel and site-specific relaxation of thaumatin molecule. (A) Solvent channels superimposed along the a-axis of a thaumatin crystal high-pressure cryocooled at 200 MPa. Blue represents atomic packing at 80 K, where HDA ice is metastable. Orange represents atomic packing at 165 K, where the phase transition to LDA ice is almost complete. Size variation of the solvent channels is negligible. (B) Disulfide bond between Cys-159 and Cys-164 of the high-pressure cryocooled thaumatin upon warming (Fo electron density map, 1-σ level). Red arrow indicates electron density for the secondary rotamer conformation. The refined disulfide bond model for the second conformation is present in the electron density at 160 K. (C) Disulfide bond between Cys-159 and Cys-164 of thaumatin at ambient pressure. The disulfide bond model refined into the second conformation electron density (red arrow) is not shown to clarify the electron density.
Fig. 4.
Fig. 4.
Thaumatin B factors to probe for molecular relaxation. (A) B-factor profiles of thaumatin high-pressure cryocooled at 200 MPa along its main chain are shown. Each profile is 1 of 13 profiles from 80 to 165 K (blue = low temperatures and red = high temperatures). The B-factor profile from thaumatin at ambient conditions (0.1 MPa and 293 K) is superimposed as a reference (dotted black line). (B) B-factor profiles of thaumatin cryocooled at ambient pressure (0.1 MPa) are shown. Each profile is 1 of 13 profiles from 80 to 165 K (blue = low temperatures and red = high temperatures). The dotted black line is the profile at ambient conditions.

References

    1. Angell CA. In: Water: A Comprehensive Treatise. Franks F, editor. Vol 7. New York: Plenum; 1982. pp. 1–81.
    1. Debenedetti PG, Stanley HE. Supercooled and glassy water. Phys Today. 2003;56:40–46.
    1. Debenedetti PG. Supercooled and glassy water. J Phys Condens Matter. 2003;15:R1669–R1726.
    1. Speedy RJ. Stability-limit conjecture. An interpretation of the properties of water. J Phys Chem. 1982;86:982–991.
    1. Stanley HE, Teixeira J. Interpretation of the unusual behavior of H2O and D2O at low temperatures: Tests of a percolation model. J Chem Phys. 1980;73:3404–3422.

Publication types

LinkOut - more resources