

Fibroblast growth factor receptor 1-transformed mammary epithelial cells are dependent on RSK activity for growth and survival
- PMID: 19258500
- PMCID: PMC11888581
- DOI: 10.1158/0008-5472.CAN-08-3398
Fibroblast growth factor receptor 1-transformed mammary epithelial cells are dependent on RSK activity for growth and survival
Erratum in
- Cancer Res. 2009 Aug 1;69(15):6366
Abstract
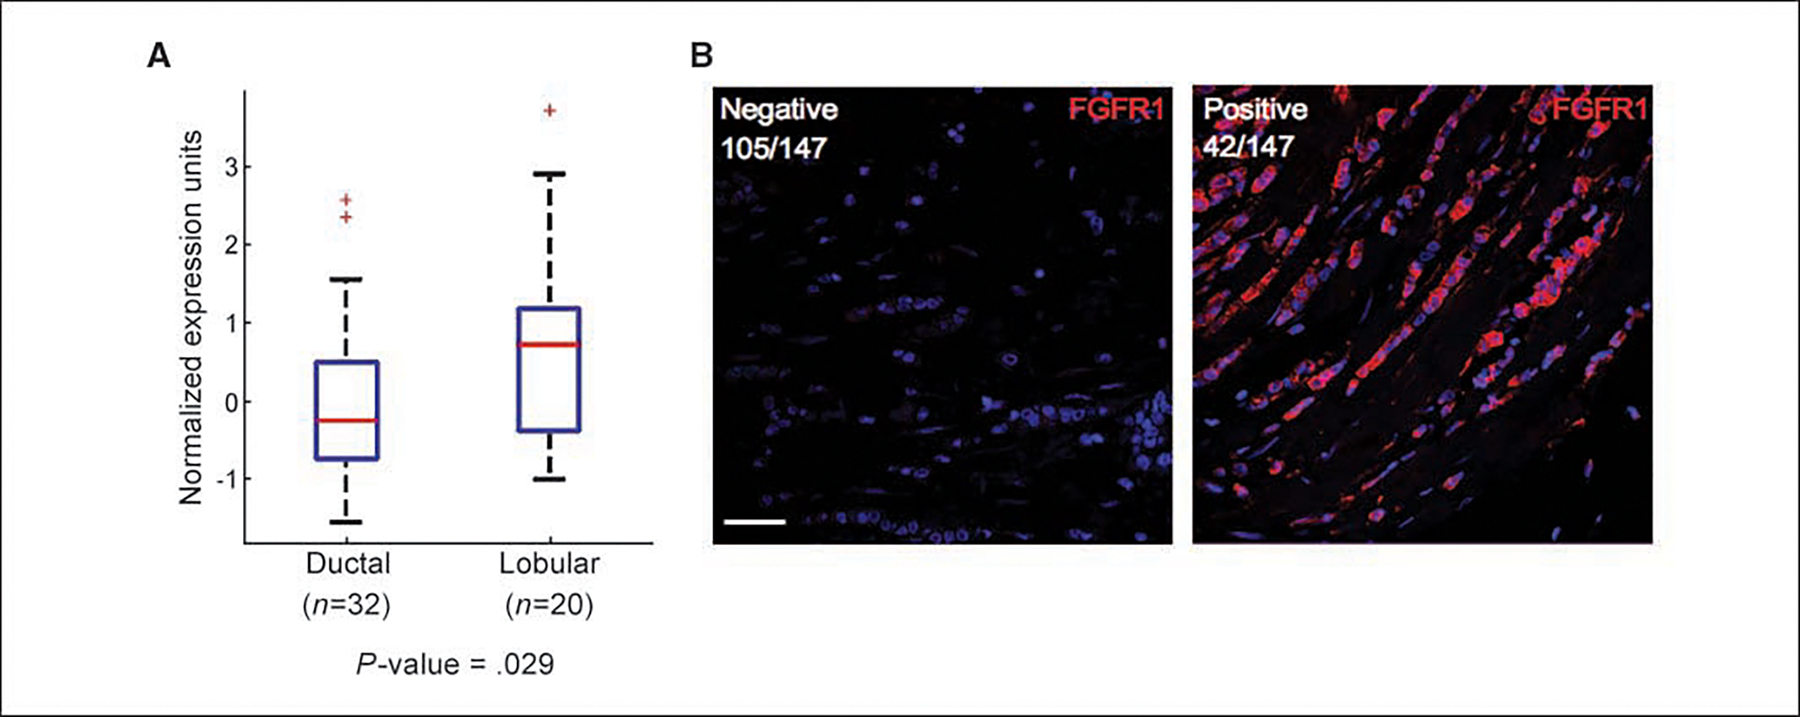
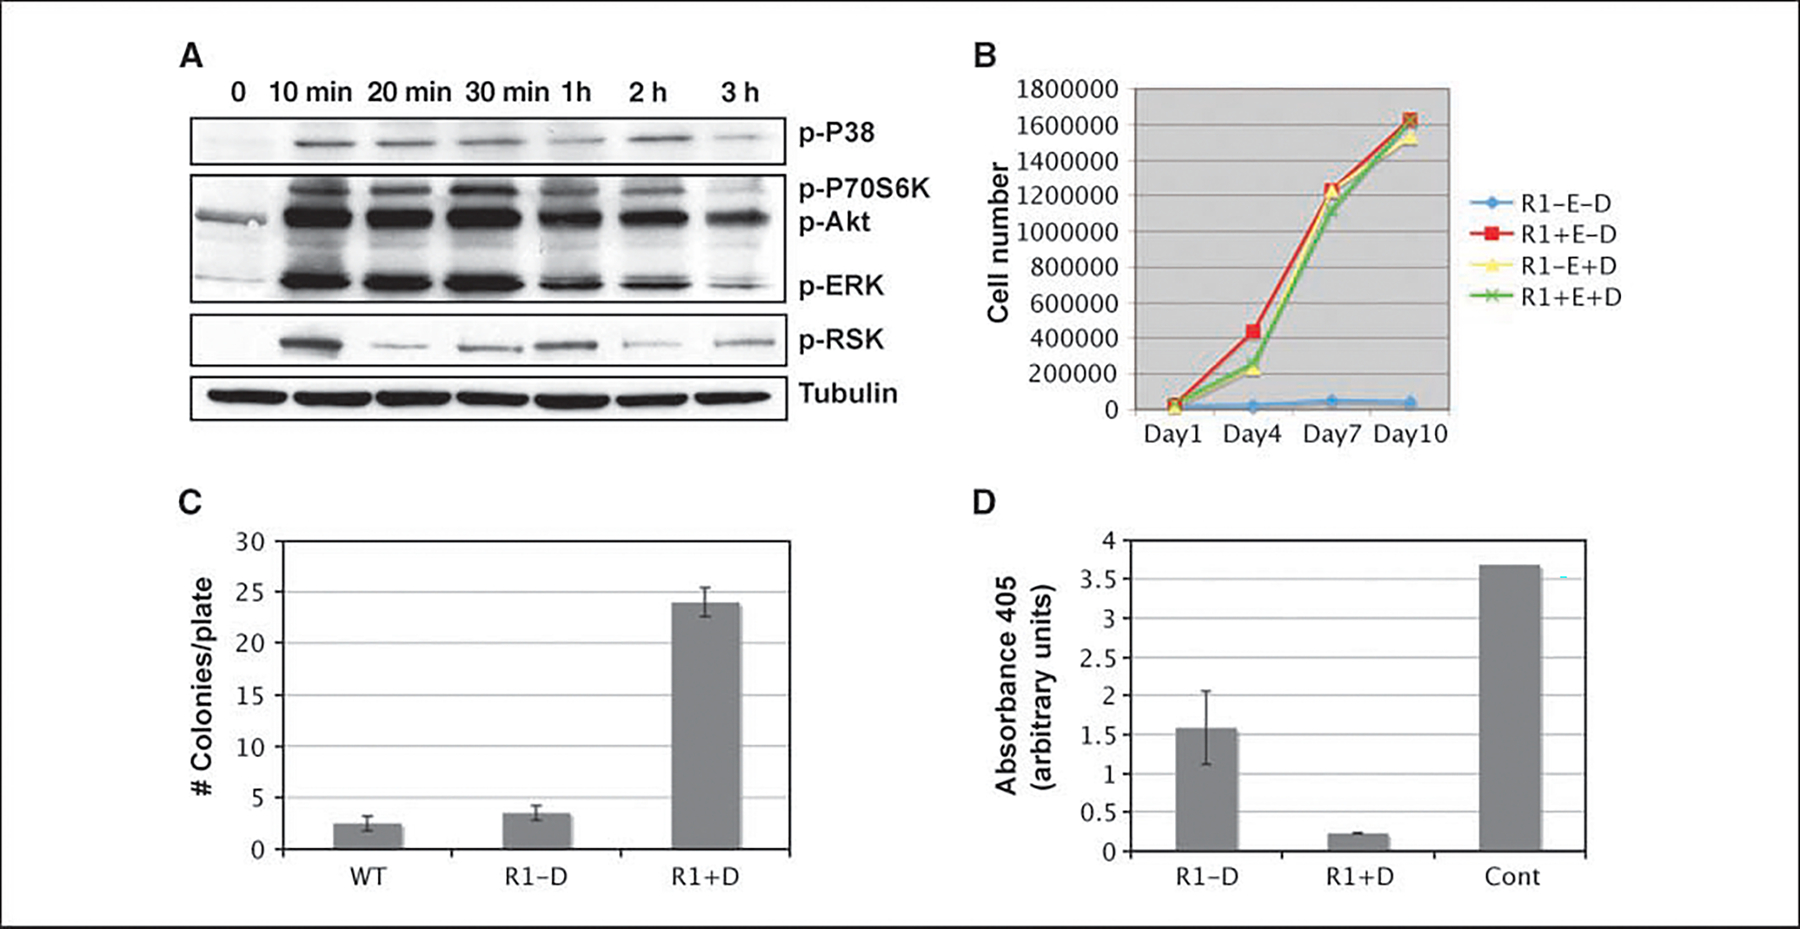
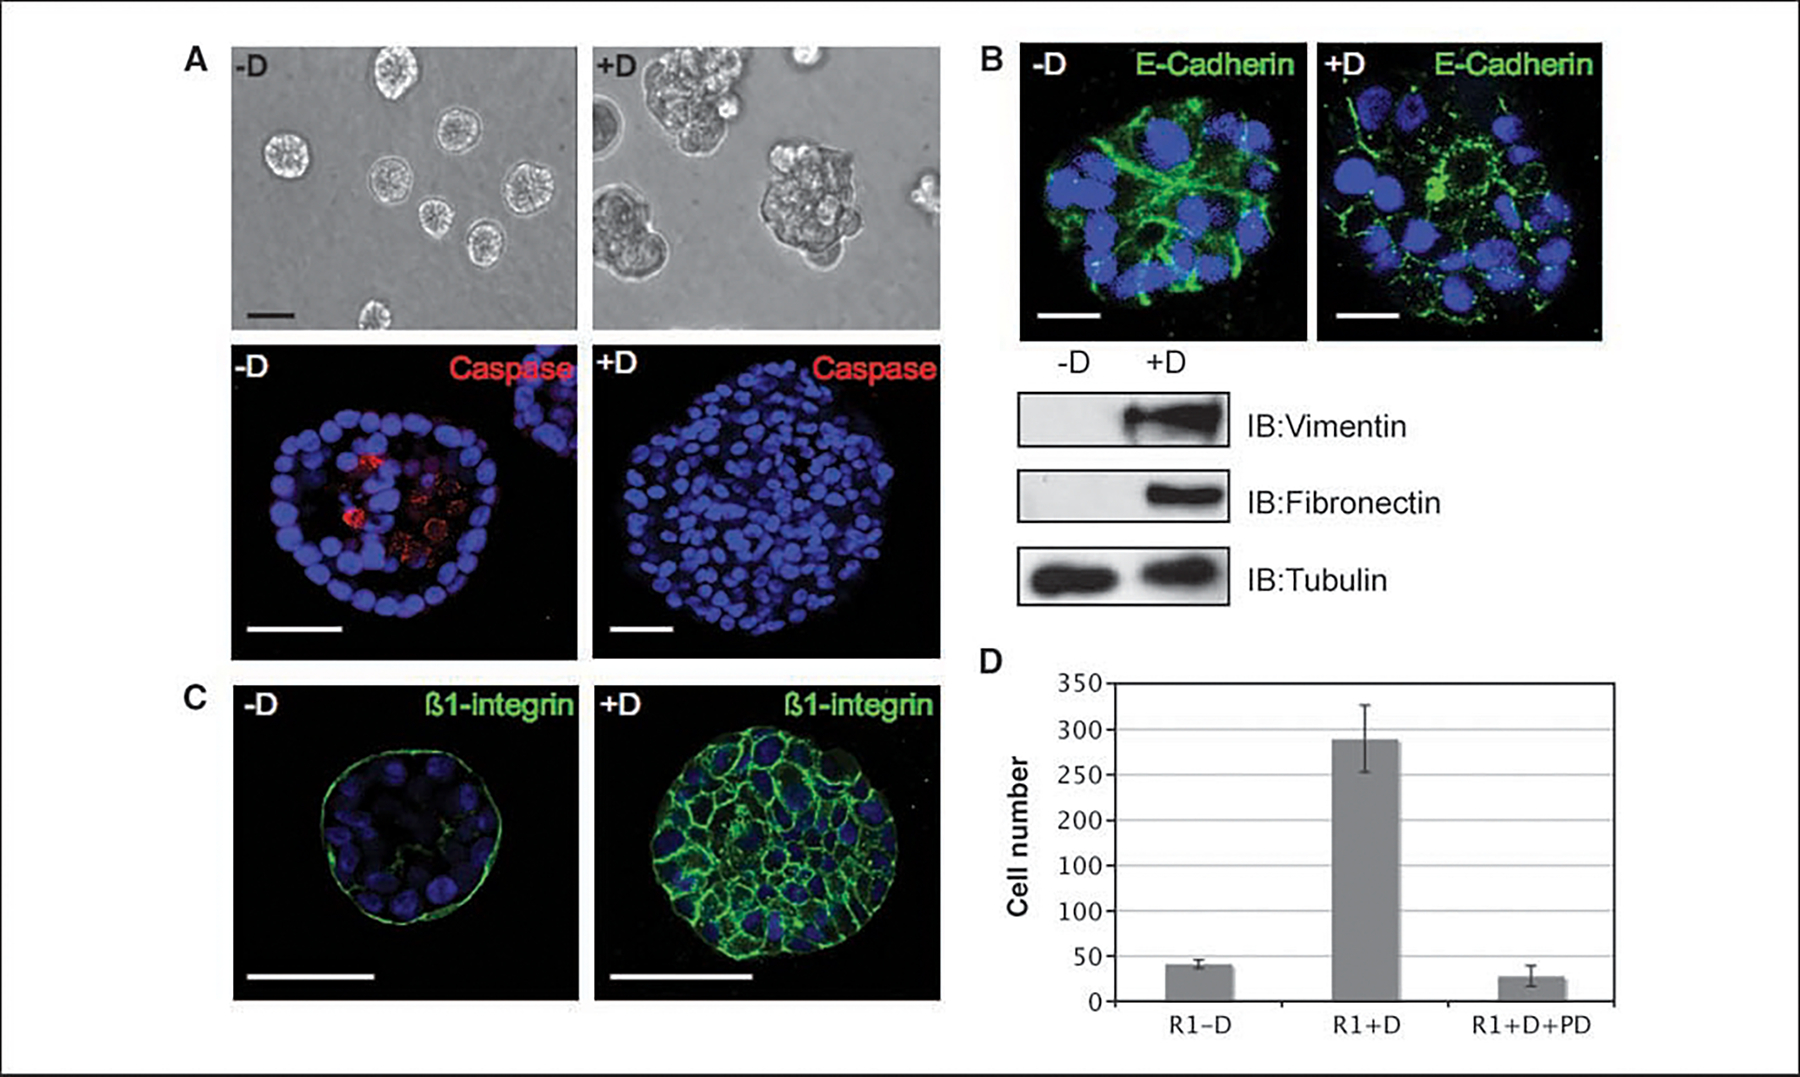
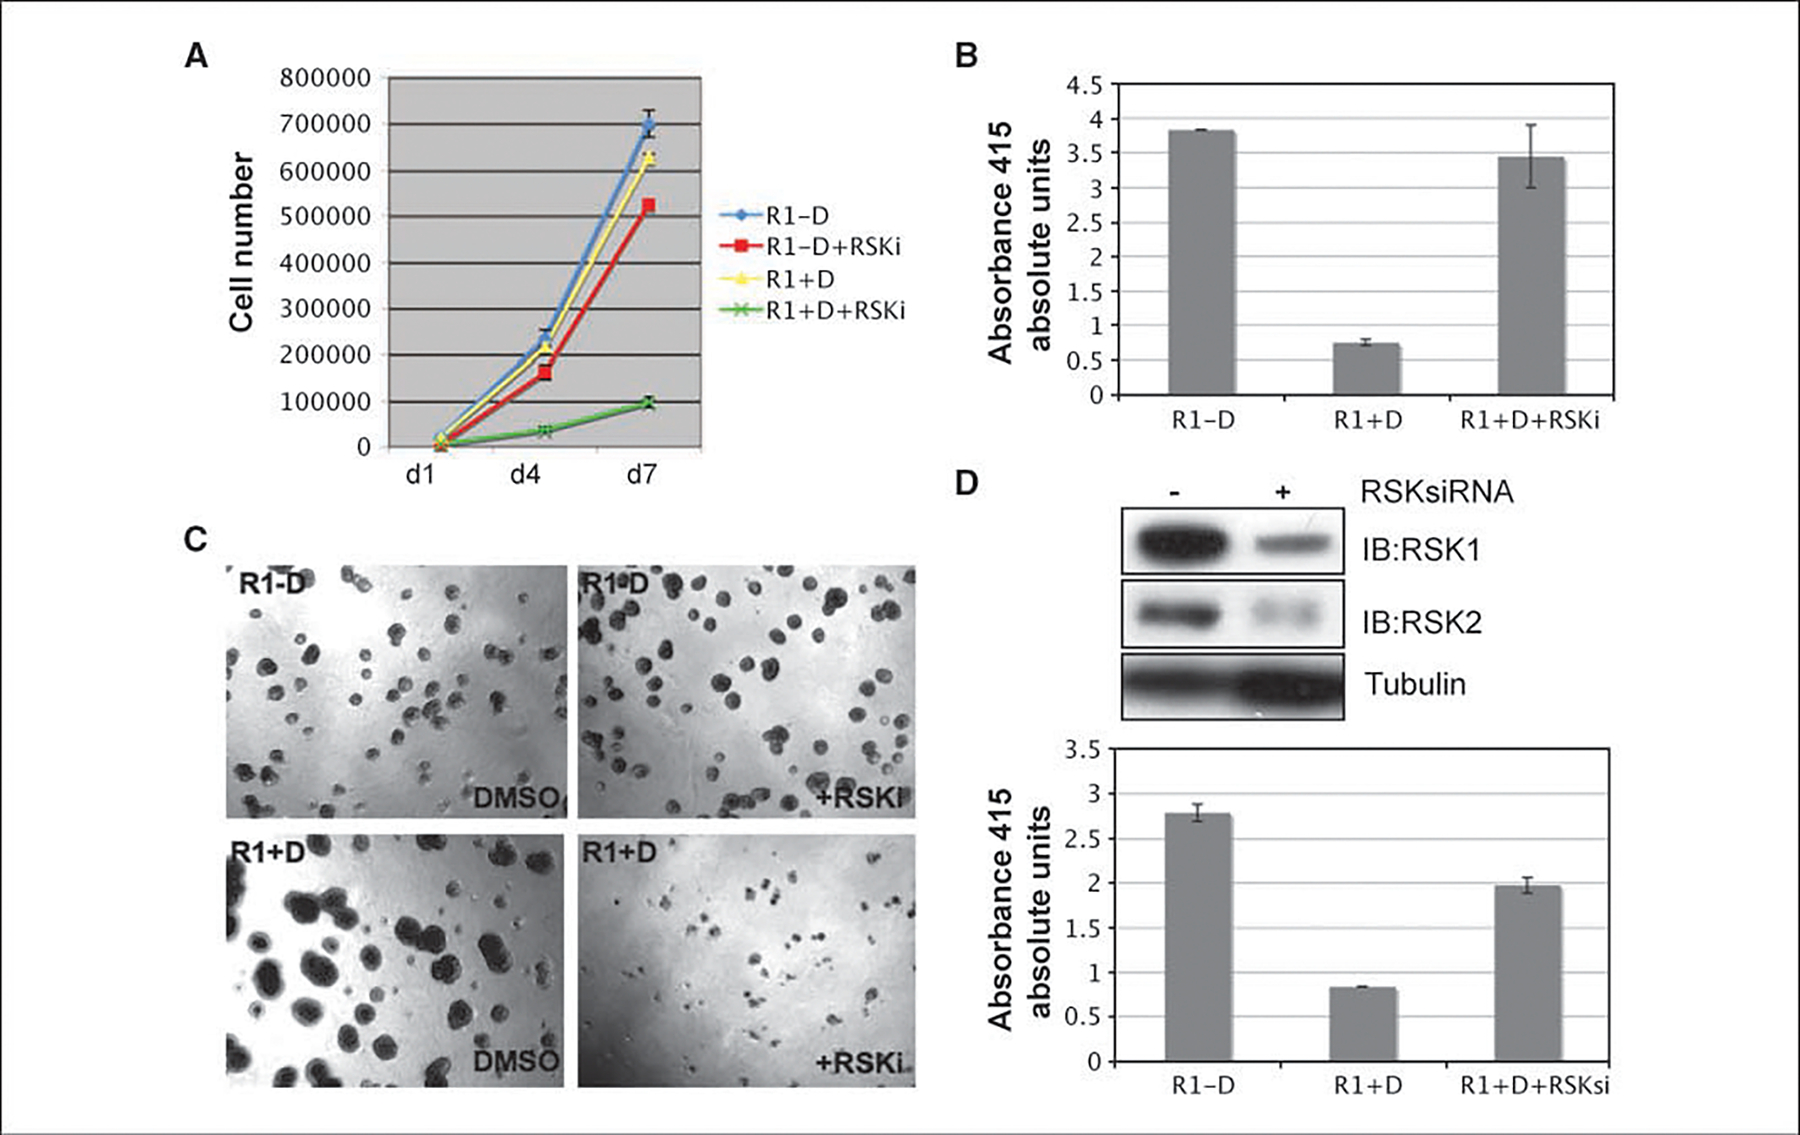
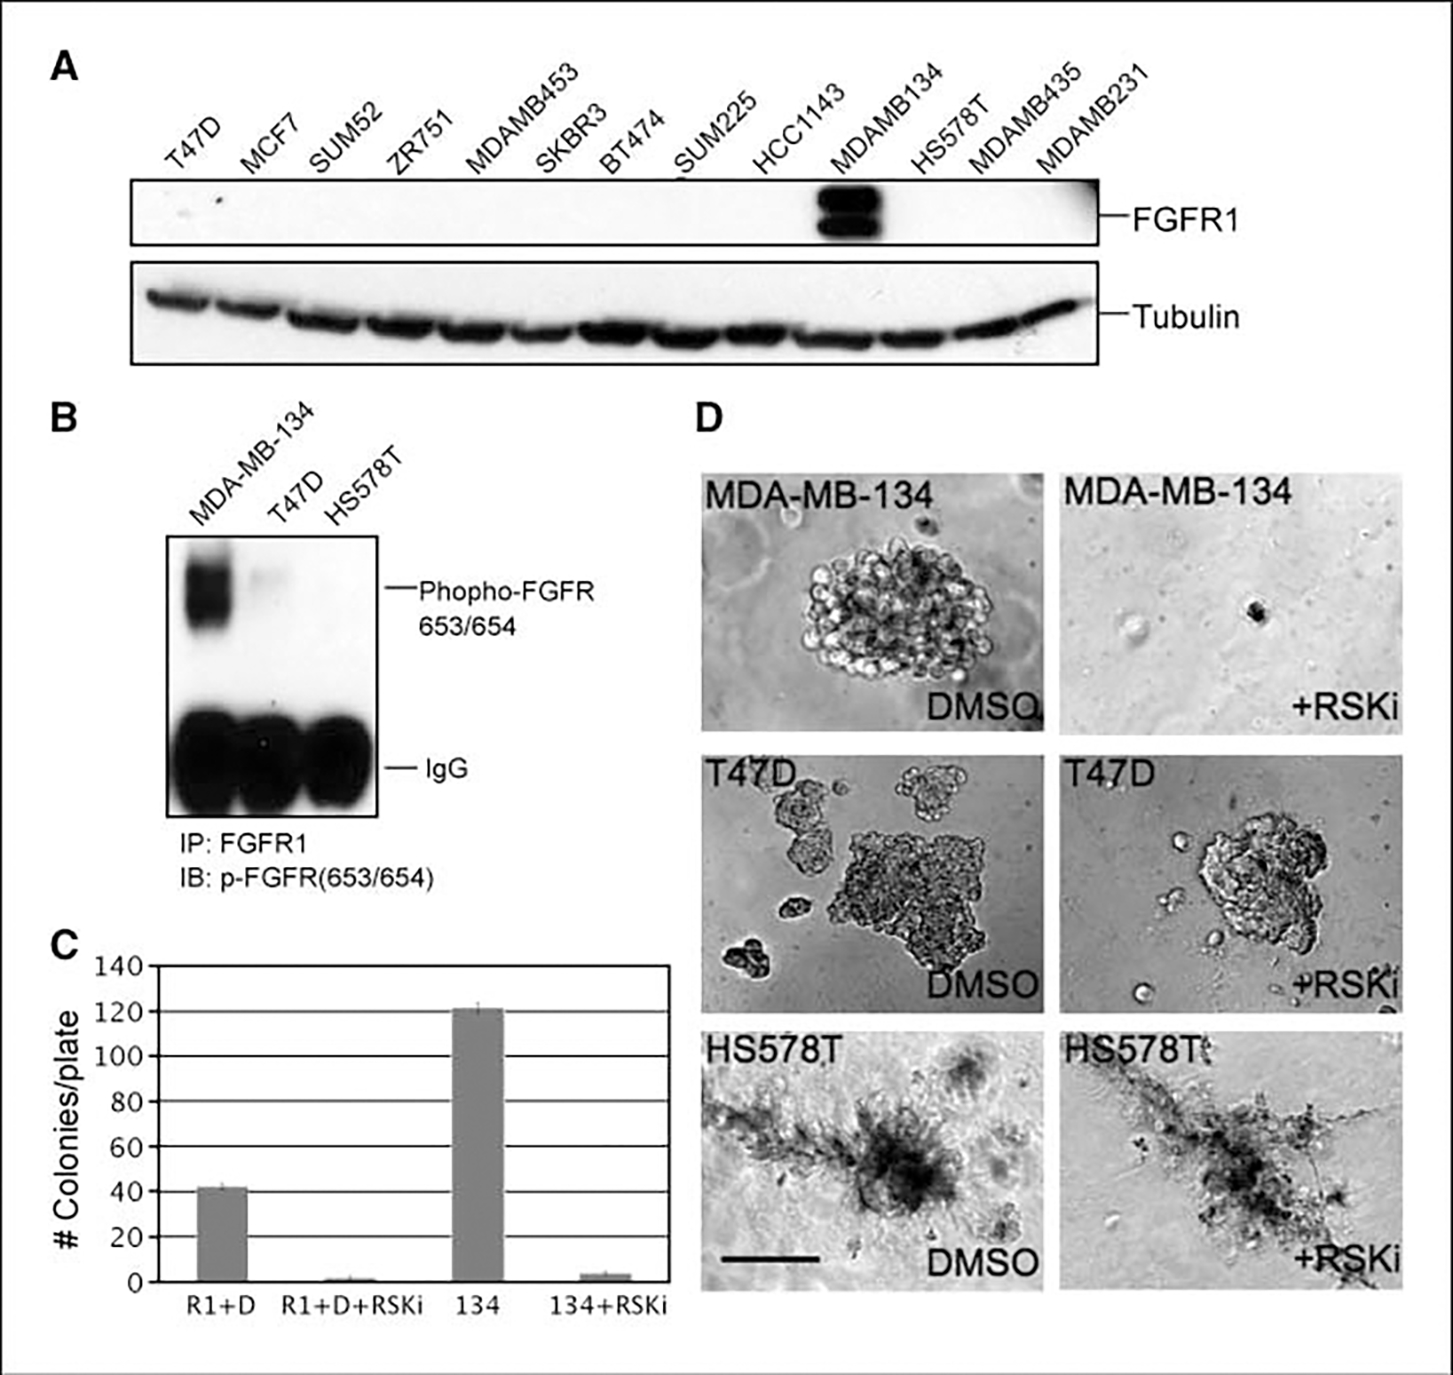
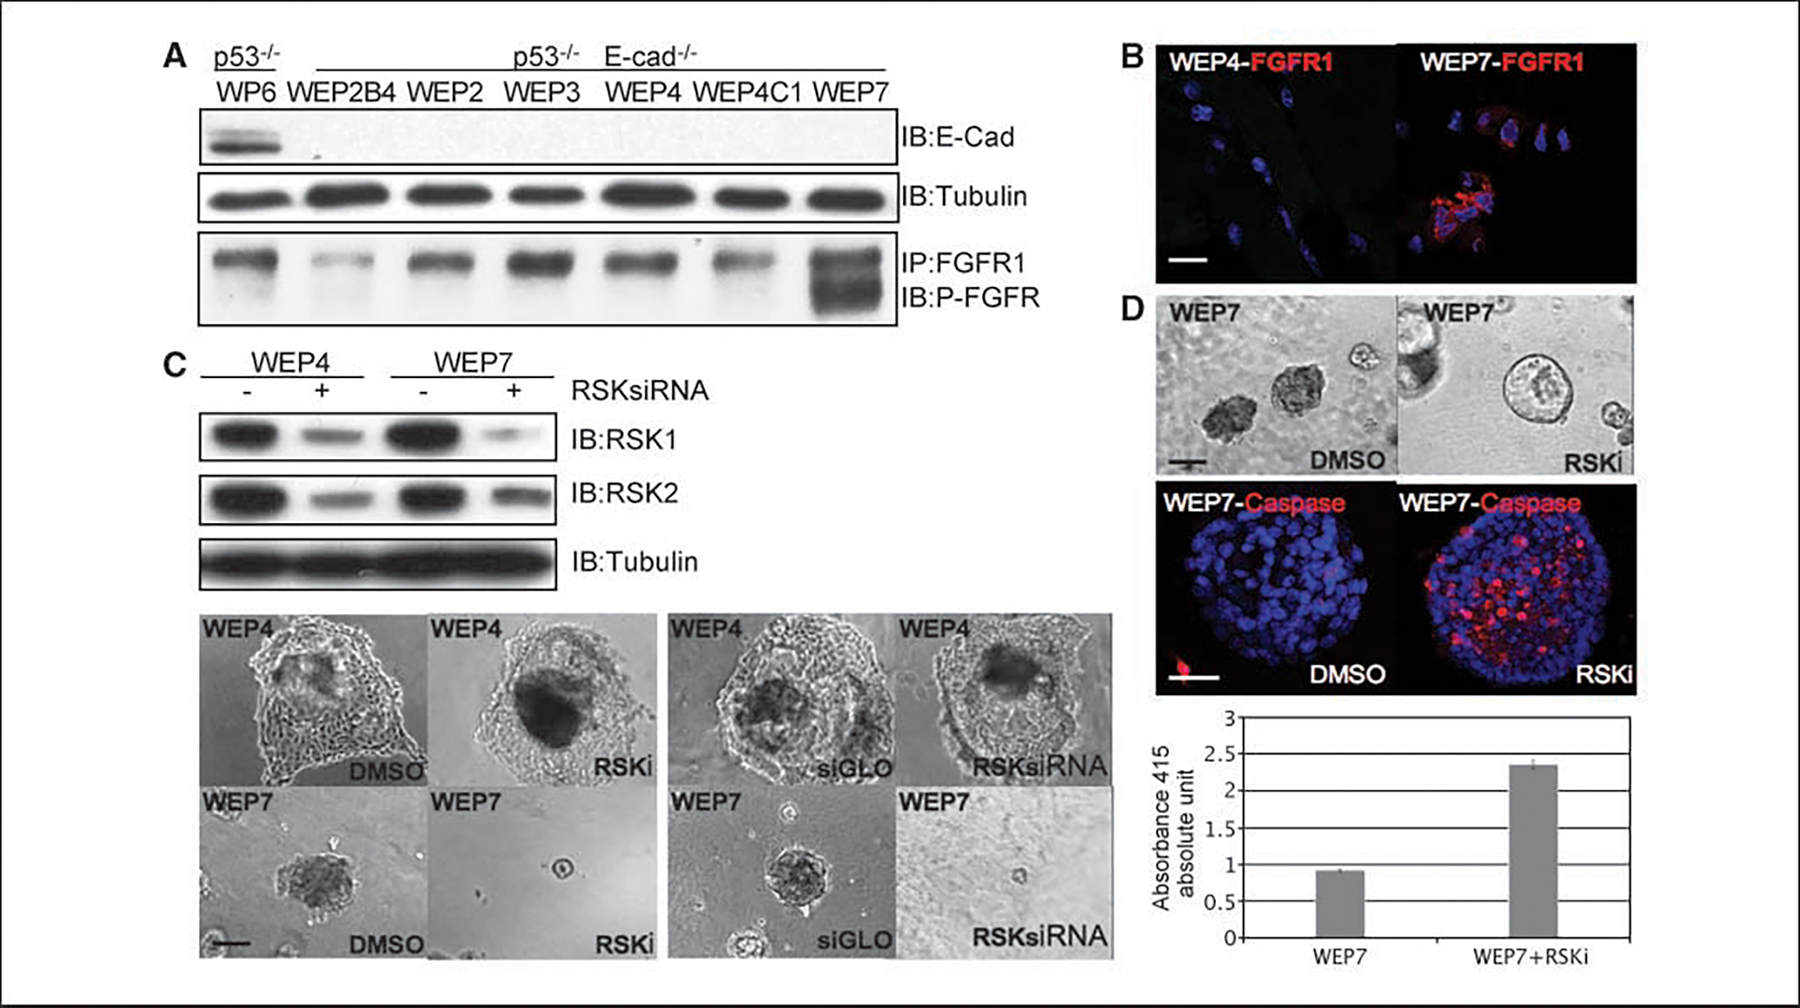
Fibroblast growth factor receptor 1 (FGFR1) is frequently amplified and highly expressed in lobular carcinomas of the breast. In this report, we evaluated the biological activity of FGFR1 in a wide range of in vitro assays. Conditional activation of FGFR1 in the nontransformed MCF10A human mammary cell line, MCF10A, resulted in cellular transformation marked by epidermal growth factor-independent cell growth, anchorage-independent cell proliferation and survival, loss of cell polarity, and epithelial-to-mesenchymal transition. Interestingly, small-molecule or small interfering RNA inhibition of ribosomal S6 kinase (RSK) activity induced death of the FGFR1-transformed cells, but not of the parental MCF10A cell line. The dependence of FGFR1-transformed cells on RSK activity was further confirmed in cell lines derived from mouse and human lobular carcinomas that possess high FGFR1 activity. Taken together, these results show the transforming activity of FGFR1 in mammary epithelial cells and identify RSK as a critical component of FGFR1 signaling in lobular carcinomas, thus implicating RSK as a candidate therapeutic target in FGFR1-expressing tumors.
Conflict of interest statement
Disclosure of Potential Conflicts of Interest
No potential conflicts of interest were disclosed.
Figures
Similar articles
-
Mammary tumorigenesis induced by fibroblast growth factor receptor 1 requires activation of the epidermal growth factor receptor.J Cell Sci. 2011 Sep 15;124(Pt 18):3106-17. doi: 10.1242/jcs.082651. Epub 2011 Aug 24. J Cell Sci. 2011. PMID: 21868365 Free PMC article.
-
Fibroblast growth factor receptor splice variants are stable markers of oncogenic transforming growth factor β1 signaling in metastatic breast cancers.Breast Cancer Res. 2014 Mar 11;16(2):R24. doi: 10.1186/bcr3623. Breast Cancer Res. 2014. PMID: 24618085 Free PMC article.
-
TNFAIP3 is required for FGFR1 activation-promoted proliferation and tumorigenesis of premalignant DCIS.COM human mammary epithelial cells.Breast Cancer Res. 2018 Aug 15;20(1):97. doi: 10.1186/s13058-018-1024-9. Breast Cancer Res. 2018. PMID: 30111373 Free PMC article.
-
Noncanonical TGF-β signaling during mammary tumorigenesis.J Mammary Gland Biol Neoplasia. 2011 Jun;16(2):127-46. doi: 10.1007/s10911-011-9207-3. Epub 2011 Mar 31. J Mammary Gland Biol Neoplasia. 2011. PMID: 21448580 Free PMC article. Review.
-
Crosstalk between STAT5 activation and PI3K/AKT functions in normal and transformed mammary epithelial cells.Mol Cell Endocrinol. 2017 Aug 15;451:31-39. doi: 10.1016/j.mce.2017.04.025. Epub 2017 May 8. Mol Cell Endocrinol. 2017. PMID: 28495456 Free PMC article. Review.
Cited by
-
Exploiting the fibroblast growth factor receptor-1 vulnerability to therapeutically restrict the MYC-EZH2-CDKN1C axis-driven proliferation in Mantle cell lymphoma.Leukemia. 2023 Oct;37(10):2094-2106. doi: 10.1038/s41375-023-02006-8. Epub 2023 Aug 19. Leukemia. 2023. PMID: 37598282 Free PMC article.
-
Atlas of Lobular Breast Cancer Models: Challenges and Strategic Directions.Cancers (Basel). 2021 Oct 27;13(21):5396. doi: 10.3390/cancers13215396. Cancers (Basel). 2021. PMID: 34771558 Free PMC article. Review.
-
p90RSK2 is essential for FLT3-ITD- but dispensable for BCR-ABL-induced myeloid leukemia.Blood. 2011 Jun 23;117(25):6885-94. doi: 10.1182/blood-2010-10-315721. Epub 2011 Apr 28. Blood. 2011. PMID: 21527514 Free PMC article.
-
Caffeic acid phenethyl ester suppresses metastasis of breast cancer cells by inactivating FGFR1 via MD2.PLoS One. 2023 Jul 25;18(7):e0289031. doi: 10.1371/journal.pone.0289031. eCollection 2023. PLoS One. 2023. PMID: 37490511 Free PMC article.
-
RSK in tumorigenesis: connections to steroid signaling.Steroids. 2010 Mar;75(3):191-202. doi: 10.1016/j.steroids.2009.12.010. Epub 2010 Jan 4. Steroids. 2010. PMID: 20045011 Free PMC article. Review.
References
-
- Althuis MD, Dozier JM, Anderson WF, Devesa SS, Brinton LA. Global trends in breast cancer incidence and mortality 1973–1997. Int J Epidemiol 2005;34:405–12. - PubMed
-
- Smith DB, Howell A, Wagstaff J. Infiltrating lobular carcinoma of the breast: response to endocrine therapy and survival. Eur J Cancer Clin Oncol 1987;23:979–82. - PubMed
-
- Mathieu MC, Rouzier R, Llombart-Cussac A, et al. The poor responsiveness of infiltrating lobular breast carcinomas to neoadjuvant chemotherapy can be explained by their biological profile. Eur J Cancer 2004;40:342–51. - PubMed
Publication types
MeSH terms
Substances
Grants and funding
LinkOut - more resources
Full Text Sources
Other Literature Sources
Medical
Miscellaneous
