. 2009 Apr;119(4):1019-28.
doi: 10.1172/JCI36534. Epub 2009 Mar 2.

Th2 cell hyporesponsiveness during chronic murine schistosomiasis is cell intrinsic and linked to GRAIL expression

Affiliations

Th2 cell hyporesponsiveness during chronic murine schistosomiasis is cell intrinsic and linked to GRAIL expression

Justin J Taylor et al. J Clin Invest. 2009 Apr.

Abstract

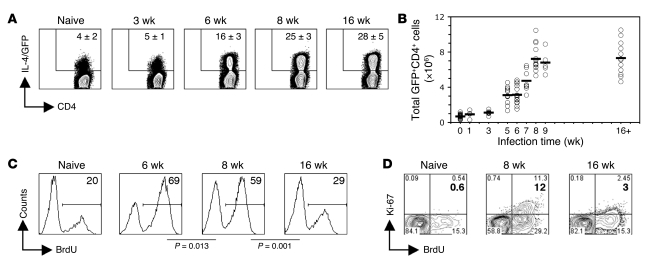
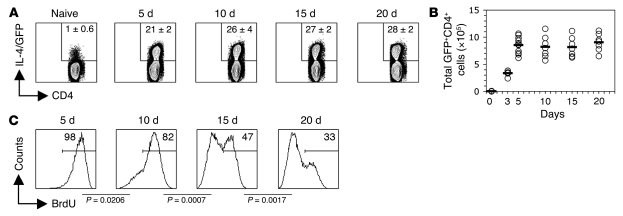
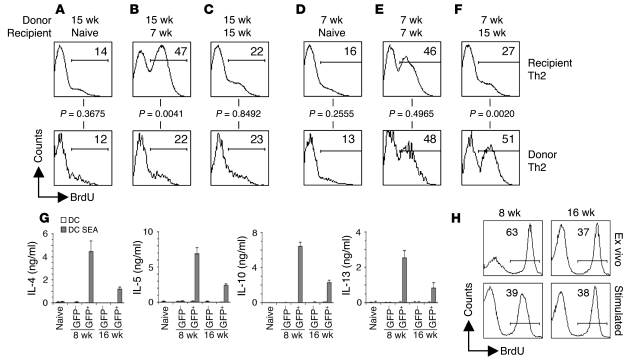
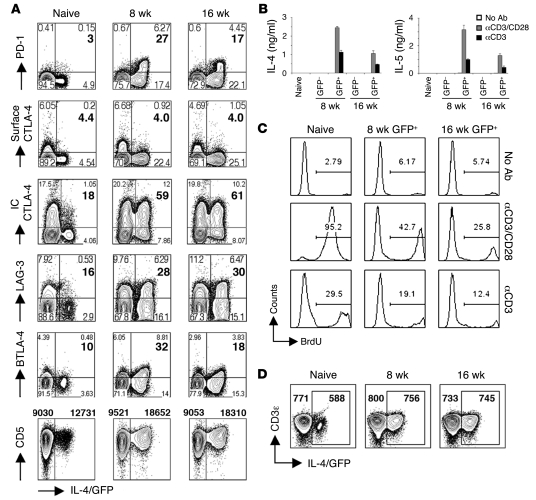
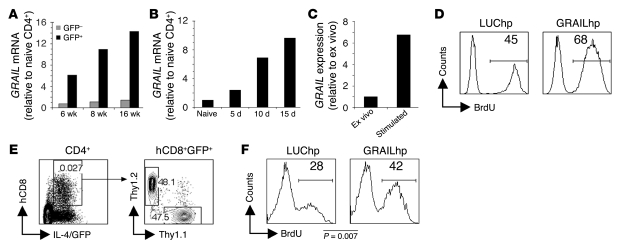
Chronic infections are associated with progressively declining T cell function. Infections with helminth parasites, such as Schistosoma mansoni, are often chronic and characterized by the development of strong Th2 responses that peak during the acute stage of infection and then decline despite ongoing infection; this minimizes Th2-dependent immunopathology during the chronic stage of infection. We sought to understand the basis for the decline in Th2 responses in chronic schistosomiasis. Using IL-4 reporter mice (mice that express EGFP as a reporter for Il4 gene expression) to identify Th2 cells, we found that Th2 cell numbers plateaued during acute infection and remained constant thereafter. However, the percentages of Th2 cells proliferating during late infection were strikingly lower than those during acute infection. Th2 cell hyporesponsiveness was evident within 10 d of initiation of the Th2 response and became progressively ingrained thereafter, in response to repeated Ag stimulation. Gene expression analyses implicated the E3-ubiquitin ligase gene related to anergy in lymphocytes (GRAIL) in the hyporesponsive state. Consistent with this, suppression of GRAIL expression using retrovirally delivered siRNA prevented the development of hyporesponsiveness induced by repeated Ag stimulation in vitro or in vivo. Together, these data indicate that the decline in Th2 cell responsiveness during chronic schistosomiasis is the net result of the upregulation of GRAIL expression in response to repeated Ag stimulation.


Figures

Figure 1
Figure 1. The Th2 population is maintained but hyporesponsive during chronic schistosome infection.
(A) At 3, 6, 8, and 16 wk after infection, CD4+ splenocytes from control uninfected 4get mice, as well as mice infected with S. mansoni for the indicate times, were analyzed ex vivo for the expression of IL-4/GFP by flow cytometry. Numbers within plots indicate mean ± SD percent CD4+ cells that are IL-4/GFP+ (3–5 mice per group). (B) Total number of Th2 cells in the spleen, determined using the percentages measured by flow cytometry coupled with spleen cell numbers ascertained by counting. Data points are from individual mice from 6 independent experiments; horizontal lines indicate mean values. (C) BrdU incorporation into gated GFP+CD4+ cells in the spleens of naive control mice, as well as mice infected with S. mansoni for the indicated times, was assessed ex vivo following a 7-d labeling period in vivo. Numbers within histograms indicate mean percent BrdU+ cells (3–4 mice per group). (D) Same as in C, except Ki-67 expression was analyzed in addition to BrdU incorporation after a 5-d BrdU labeling period in vivo. Numbers within plots indicate percent cells in the respective quadrants. Bold numbers indicate mean percent Ki-67+ cells (3–4 mice per group). Plots and quadrant statistics are from representative animals.
Figure 2
Figure 2. Chronic stimulation with SEA induces Th2 hyporesponsiveness.
(A) Mice infected with S. mansoni received 1 or more egg injections. Repeat egg injections were 5 d apart, such that mice for the 20-d time point had received 4 injections prior to sacrifice. At 5, 10, 15, and 20 d after the first immunization, CD4+ T cells from draining popliteal LNs were analyzed ex vivo for the expression of IL-4/GFP by flow cytometry. Numbers within plots indicate mean ± SD percent of CD4+ cells that were IL-4/GFP+ (3 mice per group). (B) Total number of Th2 cells, determined using the percentages measured by flow cytometry coupled with spleen cell numbers ascertained by counting. Data points are from individual mice from 4 independent experiments; horizontal lines indicate mean values. (C) BrdU incorporation into draining LN GFP+CD4+ cells was assessed ex vivo after a 5-d labeling period in vivo. Numbers within histograms indicate mean percent cells that incorporated BrdU (3 mice per group).
Figure 3
Figure 3. Cell-intrinsic Th2 hyporesponsiveness is induced by repeated stimulation with antigen.
(AF) GFP+CD4+ cells, sorted from 4get Thy1.1 mice infected with S. mansoni for 15 wk (AC) or 7 wk (DF), were adoptively transferred into naive (A and D), 7 wk infected (B and E), or 15 wk infected (C and F) congenic Thy1.1 recipients 1 d prior to BrdU labeling for 7 d. Proliferation of donor and recipient Th2 cells was assessed using flow cytometry to measure the incorporation of BrdU. Panels represent concatenated data from all mice within the experiment (3 mice per group). Numbers within histograms indicate mean percent BrdU+ cells. (G) Sorted GFP+CD4+ and GFPCD4+ cells from naive, 8 wk infected, or 16 wk infected animals were restimulated in vitro with DCs pulsed with or without SEA for 72 h. Cytokine concentrations in culture supernatants were measured by ELISA. Error bars denote SD of 3 measurements per group. (H) Sorted GFP+CD4+ cells from 8 wk or 16 wk infected mice were restimulated in vitro with SEA-pulsed DCs for 72 h directly ex vivo, or for 72 h after an 8-d in vitro period during which they were continuously exposed to SEA-pulsed DCs. Numbers within histograms indicate percent BrdU+ cells.
Figure 4
Figure 4. Th2 hyporesponsiveness does not rely on the ligation of inhibitory receptors.
(A) Gated CD4+ splenocytes from infected and control mice were analyzed for the expression of PD-1, surface CTLA-4, intracellular (IC) CTLA-4, LAG-3, BTLA-4, CD5, and IL-4/GFP by flow cytometry. Plots shown and quadrant statistics are from representative animals (3–4 mice per group). For all plots but CD5, numbers within plots indicate percent cells in the respective quadrants, and bold numbers indicate mean percent IL-4/GFP+ cells expressing the marker. For CD5, numbers above plots indicate mean MFI. (B and C) Sorted GFP+CD4+ and GFPCD4+ cells from naive mice or mice infected with S. mansoni for 8 wk or 16 wk were restimulated in vitro with plate-bound anti-CD3 alone or with anti-CD28 for 72 h. Control mice received no antibody. (B) Cytokine concentrations in culture supernatants were measured by ELISA. Error bars denote SD of 3 measurements per group. (C) Proliferation was assessed using flow cytometry to determine the incorporation of BrdU during the 72-h culture period. Numbers within histograms indicate percent BrdU+ cells. (D) Gated CD4+ splenocytes from infected and control mice were analyzed for the expression of CD3ε and IL-4/GFP by flow cytometry. Plots are from representative animals. Numbers within plots indicate mean CD3ε MFI within IL-4/GFP+ and IL-4/GFP cells (3–4 mice per group).
Figure 5
Figure 5. Increased GRAIL underlies Th2 cell hyporesponsiveness.
(A) At 6, 8, and 16 wk after infection, GFP+CD4+ and GFPCD4+ cells from S. mansoni–infected and CD4+ cells from uninfected 4get mice were analyzed by real-time RT-PCR for GRAIL mRNA. (B) At 5, 10, and 15 d after initiation of egg injections (described in Figure 2), draining LN GFP+CD4+ cells from infected mice and CD4+ cells from naive control 4get mice were analyzed by real-time RT-PCR for GRAIL mRNA. (C) GFP+CD4+ cells from acutely infected mice were analyzed by real-time RT-PCR for GRAIL expression ex vivo or after 8 d in vitro incubation with SEA-pulsed DCs. (D) GFP+CD4+ cells from 8 wk infected mice were infected with GRAILhp or LUChp prior to 8 d stimulation with SEA-pulsed DCs. After stimulation, sorted hCD8+ cells were restimulated for 72 h with SEA-pulsed DCs. In vitro proliferation was assessed using flow cytometry to determine the incorporation of BrdU during the 72-h culture. Numbers within histograms indicate mean percent BrdU+ cells. (E and F) GFP+CD4+ cells from 4get Thy1.2 or 4get Thy1.1 mice 5 d after initiation of egg injections were infected with retrovirus prior to 1-d stimulation with SEA-pulsed DCs. Cells were then mixed and transferred into infected Balb/c mice. (E) Gating strategy used to detect hp-expressing cells in recipient animals. Numbers within plots represent the frequency of the cells within the gate. (F) BrdU incorporation into Thy1.1+ (GRAILhp) and Thy1.2+ (LUChp) CD4+IL-4/GFP+hCD8+ cells was analyzed on day 11, after a 3-d BrdU labeling period. Shown are concatenated data from all mice within the experiment (4–5 mice per group). Numbers within histograms represent mean percent BrdU+ cells.

References

    1. Schwartz R.H. T cell anergy. Annu. Rev. Immunol. 2003;21:305–334. doi: 10.1146/annurev.immunol.21.120601.141110. - DOI - PubMed
    1. Shin H., Wherry E.J. CD8 T cell dysfunction during chronic viral infection. Curr. Opin. Immunol. 2007;19:408–415. doi: 10.1016/j.coi.2007.06.004. - DOI - PubMed
    1. Mathers C.D., Ezzati M., Lopez A.D. Measuring the burden of neglected tropical diseases: the global burden of disease framework. PLoS Negl. Trop. Dis. 2007;1:e114. - PMC - PubMed
    1. Hotez P.J., et al. Helminth infections: the great neglected tropical diseases. J. Clin. Invest. 2008;118:1311–1321. doi: 10.1172/JCI34261. - DOI - PMC - PubMed
    1. van der Werf M.J., et al. Quantification of clinical morbidity associated with schistosome infection in sub-Saharan Africa. Acta Trop. 2003;86:125–139. doi: 10.1016/S0001-706X(03)00029-9. - DOI - PubMed

Publication types

MeSH terms