Case Reports
. 2009 Mar 2;17(5):4004-18.
doi: 10.1364/oe.17.004004.

Spectral domain-optical coherence tomography to detect localized retinal nerve fiber layer defects in glaucomatous eyes

Affiliations
Case Reports

Spectral domain-optical coherence tomography to detect localized retinal nerve fiber layer defects in glaucomatous eyes

Gianmarco Vizzeri et al. Opt Express. .

Abstract

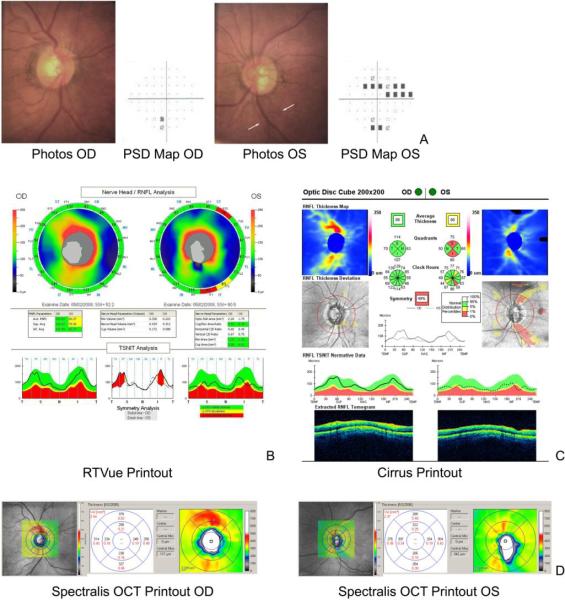
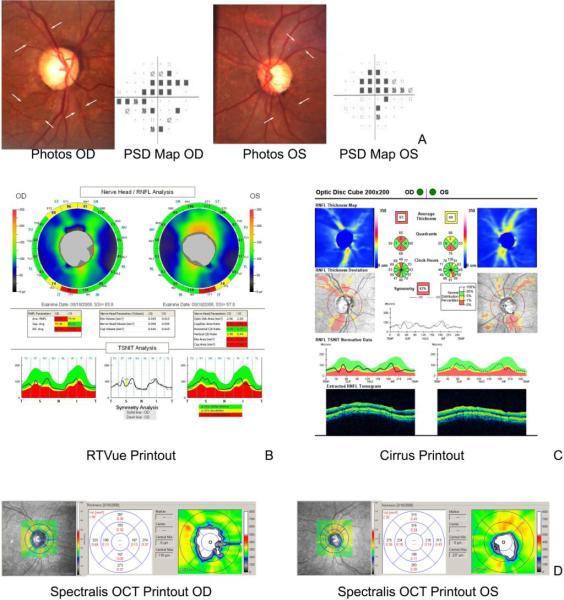
This study examines the ability of RTVue, Cirrus and Spectralis OCT Spectral domain-optical coherence tomographs (SD-OCT) to detect localized retinal nerve fiber layer defects in glaucomatous eyes. In this observational case series, four glaucoma patients (8 eyes) were selected from the University of California, San Diego Shiley Eye Center and the Diagnostic Innovations in Glaucoma Study (DIGS) based on the presence of documented localized RNFL defects in at least one eye confirmed by masked stereophotograph assessment. One RTVue 3D Disc scan, one RTVue NHM4 scan, one Cirrus Optic Disk Cube 200x200 scan and one Spectralis scan centered on the optic disc (15x15 scan angle, 768 A-scans x 73 B-scans) were obtained on all undilated eyes within a single session. Results were compared with those obtained from stereophotographs. In 6 eyes the presence of localized RNFL defects was detected by stereophotography. In general, by qualitatively evaluating the retinal thickness maps generated, all SD-OCT instruments examined were able to confirm the presence of localized glaucomatous structural damage seen on stereophotographs. This study confirms SD-OCT is a promising technology for glaucoma detection as it may assist clinicians identify the presence of localized glaucomatous structural damage.


Figures

Fig. 1
Fig. 1
Results from photographs, visual fields (pattern standard deviation map) and SD-OCT devices for Case 1. A. The photographs show an inferior notch with a localized RNFL defect at 5–6 clock hours in OS (indicated by the white arrows) associated with a corresponding repeatable superior visual field defect. B. RTVue “Nerve Head/RNFL Analysis” map divided into 16 sectors. Values outside Normal limits based on the internal normative database are shown in red (to explore RTVue 3-D scans, see View 1 for OD and View 2 for OS). C. Cirrus “RNFL Thickness Map and “RNFL Thickness Deviation” map highlight in red clock hours and peripapillary RNFL Outside Normal Limits compared to on the internal normative database (to explore Cirrus 3-D scans, see View 3 for OD and View 4 for OS). D. Spectralis OCT retinal thickness map with retinal thickness measurements (microns, in black) and volume (mm3, in red) for the 2.2 and 3.45 mm diameters at the superior, inferior, temporal and nasal quadrants (to explore Spectralis 3-D scans, see View 5 for OD and View 6 for OS). All three instruments identify the wedge-shaped RNFL defect at 5 to 6 o'clock.
Fig. 2
Fig. 2
Results from photographs, visual fields (pattern standard deviation map) and SD-OCT devices for Case 2. A. The photographs show an enlarged cup with superior and inferior rim thinning with the presence of several localized RNFL defects (OD at 5, 7 and 11–12 o'clock,and OS at 1–2 and 5–6 o'clock), as indicated by the white arrows. B. RTVue “Nerve Head/RNFL Analysis” map identifies sectors Outside Normal in red based on the internal normative (to explore RTVue 3-D scans, see View 7 for OD and View 8 for OS). C. Cirrus “RNFL Thickness Map” and “RNFL Thickness Deviation” map highlight in red clock hours and peripapillary retina areas Outside Normal Limits based on the internal normative database (to explore Cirrus 3-D scans, View 9 for OD and View 10 for OS). D. Spectralis OCT retinal thickness map with retinal thickness measurements (microns, in black) and volume (mm3, in red) for the 2.2 and 3.45 mm diameters at the superior, inferior, temporal and nasal quadrants (to explore Spectralis 3-D scans, see View 11 for OD and View 12 for OS). All 3 instruments identify RNFL defects in the superior and inferior hemifields.
Fig. 3
Fig. 3
Results from photographs, visual fields (pattern standard deviation map) and SD-OCT devices for Case 3. A. The photographs show diffuse inferior RNFL loss in both eyes, as indicated by the white arrows, associated with a repeatable bilateral superior hemifield defect. B. RTVue “Nerve Head/RNFL Analysis” map identifies in red sectors Outside Normal based on the internal normative database (to explore RTVue 3-D scans, see View 13 for OD and View 14 for OS). C. Cirrus “RNFL Thickness Map” and “RNFL Thickness Deviation” map highlight in red clock hours and peripapillary retina areas Outside Normal Limits based on the internal normative database (to explore Cirrus 3-D scans, see View 15 for OD and View 16 for OS). D. Spectralis OCT retinal thickness map with retinal thickness measurements (microns, in black) and volume (mm3, in red) for the 2.2 and 3.45 mm diameters at the superior, inferior, temporal and nasal quadrants (to explore Spectralis 3-D scans, see View 17 for OD and View 18). All 3 instruments identify RNFL loss in the inferior region.
Fig. 4
Fig. 4
Results from photographs, visual fields (pattern standard deviation map) and SD-OCT devices for Case 4. A. The photographs show an enlarged cup in both eyes, with an inferior notch in OS with localized RNFL defect at 5–7 clock hours, indicated by the white arrows. B. . RTVue “Nerve Head/RNFL Analysis” map identifies in red sectors Outside Normal based on the internal normative database (to explore RTVue 3-D scans, see View 19 for OD and View 20 for OS). C. “RNFL Thickness Map” and “RNFL Thickness Deviation” map highlight in red clock hours and peripapillary retina areas Outside Normal Limits based on the internal normative database (to explore Cirrus 3-D scans, see View 21 for OD and View 22 for OS). D. Spectralis OCT retinal thickness map with retinal thickness measurements (microns, in black) and volume (mm3, in red) for the 2.2 and 3.45 mm diameters at the superior, inferior, temporal and nasal quadrants (to explore Spectralis 3-D scans, see View 23 for OD and View 24 for OS). All 3 instruments show RNFL loss in the left eye.

References

    1. Huang D, Swanson EA, Lin CP, Schuman JS, Stinson WG, Chang W, Hee MR, Flotte T, Gregory K, Puliafito CA. Optical coherence tomography. Science. 1991;254:1178–81. - PMC - PubMed
    1. Medeiros FA, Zangwill LM, Bowd C, Vessani RM, Susanna R, Jr, Weinreb RN. Evaluation of retinal nerve fiber layer, optic nerve head, and macular thickness measurements for glaucoma detection using optical coherence tomography. Am. J. Ophthalmol. 2005;139:44–55. - PubMed
    1. Bagga H, Greenfield DS. Quantitative assessment of structural damage in eyes with localized visual field abnormalities. Am. J. Ophthalmol. 2004;137:797–805. - PubMed
    1. Jeoung JW, Park KH, Kim TW, Khwarg SI, Kim DM. Diagnostic ability of optical coherence tomography with a normative database to detect localized retinal nerve fiber layer defects. Ophthalmology. 2005;112:2157–63. - PubMed
    1. Budenz DL, Michael A, Chang RT, McSoley J, Katz J. Sensitivity and specificity of the StratusOCT for perimetric glaucoma. Ophthalmology. 2005;112:3–9. - PubMed