. 2009;53(3):145-57.
doi: 10.1007/s12013-009-9046-7.

Fluorescence lifetime imaging of endogenous fluorophores in histopathology sections reveals differences between normal and tumor epithelium in carcinoma in situ of the breast

Affiliations

Fluorescence lifetime imaging of endogenous fluorophores in histopathology sections reveals differences between normal and tumor epithelium in carcinoma in situ of the breast

Matthew W Conklin et al. Cell Biochem Biophys. 2009.

Abstract

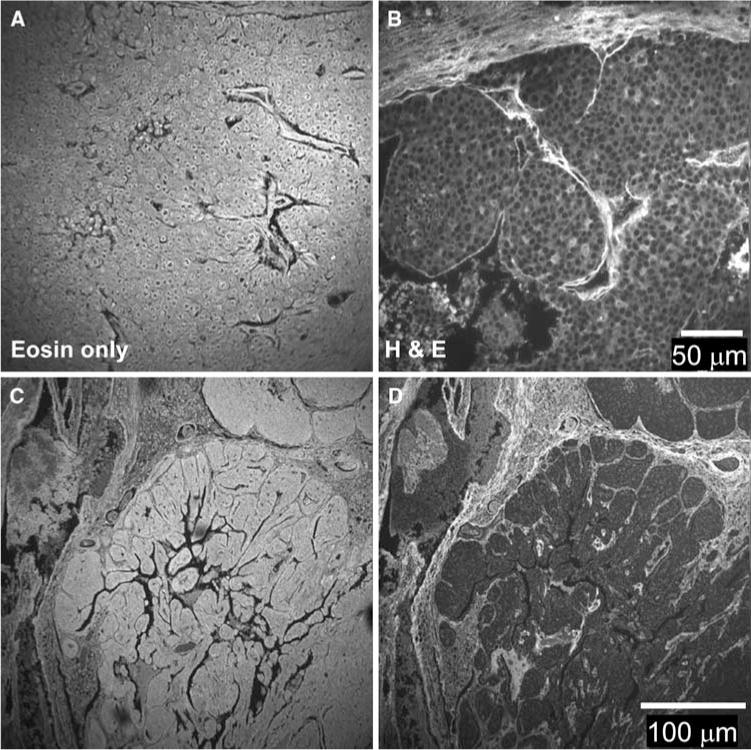
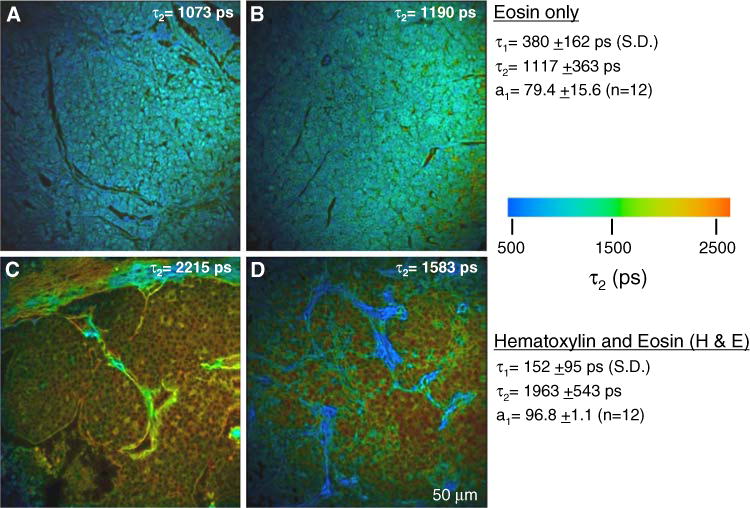
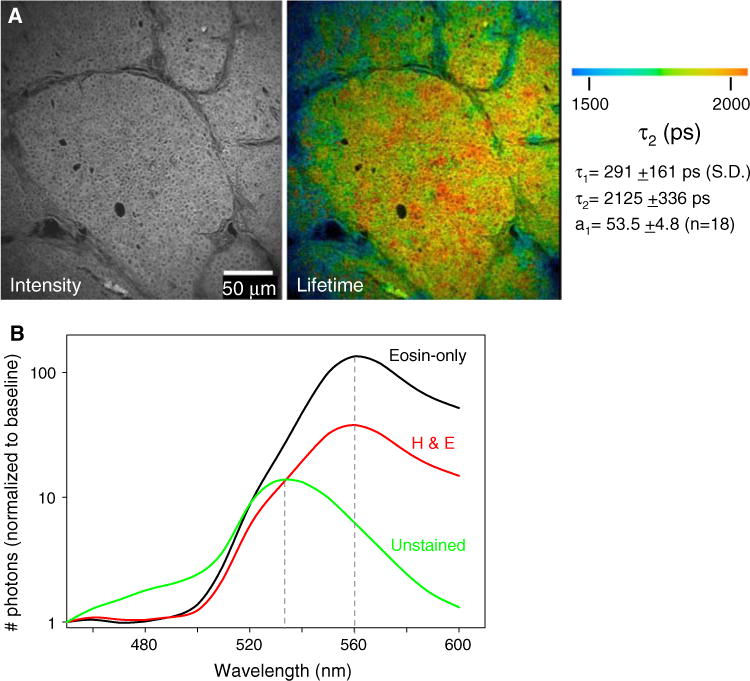
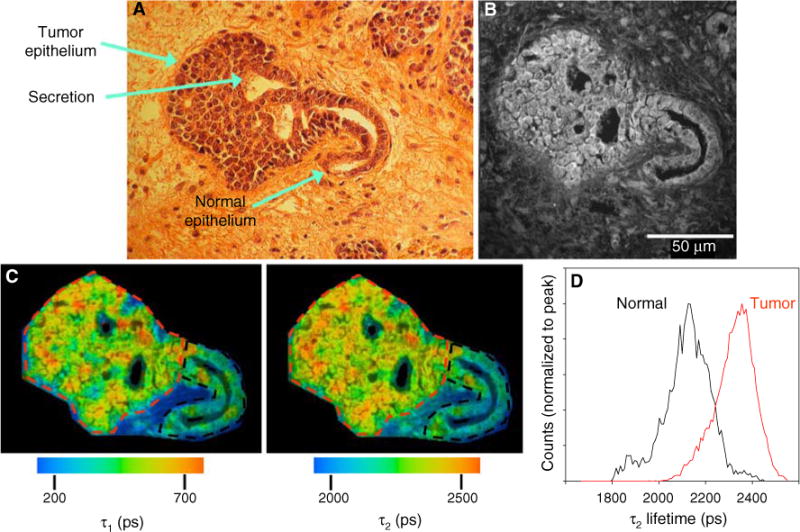
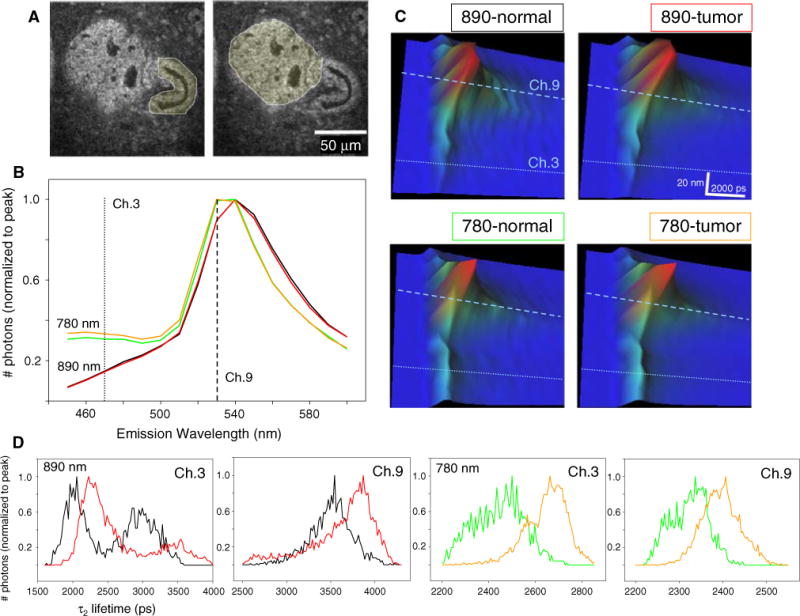
The classical examination of histology slides from a mouse model of breast cancer has been extended in this study to incorporate modern multiphoton excitation and photon-counting techniques. The advantage of such approaches is quantification of potential diagnostic parameters from the fluorescence emission signal, whereby the traditional descriptive staging process is complemented by measurements of fluorescence intensity, lifetime, and spectra. We explored whether the clinical "gold standard" of eosin and hematoxylin stained histology slides would provide optical biomarker signatures of diagnostic value. Alternatively, we examined unstained slides for changes in intensity and/or fluorescence lifetime of relevant endogenous fluorophores. Although eosin provided a strong emission signal and had distinct spectra and lifetime, we found that it was not useful as a fluorescent biological marker, particularly when combined with hematoxylin. Instead, we found that the properties of the fluorescence from the endogenous fluorophores NADH and FAD were indicative of the pathological state of the tissue. Comparing regions of carcinoma in situ to adjacent histologically normal regions, we found that tumor cells produced higher intensity and had a longer fluorescence lifetime. By imaging at 780 nm and 890 nm excitation, we were able to differentiate the fluorescence of FAD from NADH by separating the emission spectra. The shift to a longer lifetime in tumor cells was independent of the free or bound state of FAD and NADH, and of the excitation wavelength. Most forms of cancer have altered metabolism and redox ratios; here we present a method that has potential for early detection of these changes, which are preserved in fixed tissue samples such as classic histopathology slides.


Figures

Fig. 1
Fig. 1
Fluorescence intensity of stained mouse breast tumor samples. a Paraffin-embedded tissue sections were stained with eosin. The fluorescence intensity showed staining in the cytoplasm of cells as well as the surrounding stroma. b Paraffin-embedded tissue sections were stained with H&E. The staining pattern of fluorescence intensity staining pattern was changed such that the intensity of eosin staining in cells was diminished but bright staining of the stroma is still visible. c, d Serial sections stained with eosin-only and H&E, respectively, are shown at lower magnification than A&B. Note the alteration in the staining pattern due to hematoxylin application
Fig. 2
Fig. 2
Fluorescence lifetime of stained mouse breast tumor samples. a, b In slides stained with eosin only, the fluorescence lifetime is similar throughout the field of view. Regions that encompassed cells and ECM are shown. c, d This value for eosin fluorescence lifetime was preserved in the extracellular matrix regions of H&E stained slides, where hematoxylin does not compete for staining. However, the lifetime of eosin is significantly lengthened in cells compared to eosin only. For each condition, two exemplar images out of 12 are shown. Population averages for the lifetime values are given on the right and the τ2 value for each individual panel shown is indicated
Fig. 3
Fig. 3
FLIM imaging of endogenous fluorophores in unstained tissue sections. a Fluorescence intensity and lifetime images of unstained tissue sections at 890 nm excitation. At this wavelength, detectable fluorescence emission intensity from FAD was generated. FAD had a distinct lifetime, and because collagen itself is autofluorescent it was observed in both intensity (left) and lifetime images (right). Lifetime values measured for the entire image field are given on the right. b Emission spectra for the variously stained slides as measured with a 16-channel spectral lifetime detector reveals a lack of change in the value of the peak emission between eosin stained slides that do or do not contain hematoxylin. Unstained slides had a shifted emission peak, because the fluorophore is endogenous FAD, not eosin. The spectra shown are from only one image for each condition, but were of the same peak emission in all samples tested
Fig. 4
Fig. 4
The fluorescent properties of normal and tumor epithelium differ. a Digital camera image of H&E stained mouse breast tumor. At this stage of tumor progression, which shows a carcinoma in situ, the distinction between normal epithelium and tumor is evident. Secretion of milk proteins into the remaining duct was preserved in the fixation procedure and, interestingly, was observed to be fluorescent. b Fluorescence intensity image of the sequential unstained slide at 890 nm excitation. c Color maps of the τ1 (left) and τ2 (right) components of the fluorescence lifetime, which illustrate the relatively longer lifetime values in tumor cells when compared to normal epithelium. d Histogram analysis measuring the range of lifetime values of the two ROIs drawn in (c) reveals the shift to longer lifetimes in tumor (red lines) cells compared to normal epithelium (color online)
Fig. 5
Fig. 5
Correlation between fluorescence lifetime and emission wavelength. a Intensity images of a carcinoma in situ region where the regions of interest traced to separate normal from tumor analysis is shown. b Emission spectra normalized to peak photon-counts from 890 nm excitation (black line for normal, red line for tumor) and 780 nm excitation (green line for normal, orange line for tumor) show that the presence of higher photon-counts in channel 3 is due to excitation of NADH at shorter wavelengths and not due to differences between normal epithelium (black, green lines) versus tumor (red, orange lines). (c) 3D plot where the lifetime, emission spectra, and photon-counts are plotted in xyz, respectively. The longer lifetime in channel 9 is observed at each excitation wavelength and tissue type analyzed. The greater representation of emission in channel 3 when excited at 780 nm can be seen as brighter cyan coloring indicating higher amplitude in the z-axis. d Histograms of τ2 values normalized to peak photon-counts of normal (black line at 890 nm, green line at 780 nm excitation) versus tumor (red line at 890 nm, orange line at 780 nm excitation) regions. Note that there is always a shift to a longer lifetime in tumor tissue. Furthermore the lifetime value is correlated with the emission wavelength, where the shorter emission photons (channel 3) have shorter lifetimes than those found at the peak emission (channel 9) (color online)

Similar articles

Cited by

References

    1. Eliceiri KW, Fan CH, Lyons GE, White JG. Analysis of histology specimens using lifetime multiphoton microscopy. Journal of Biomedical Optics. 2003;8:376–380. - PubMed
    1. Saikia B, Gupta K, Saikia UN. The modern histopathologist: In the changing face of time. Diagnostic Pathology. 2008;3:25. - PMC - PubMed
    1. Chance B, Cohen P, Jobsis F, Schoener B. Intracellular oxidation–reduction states in vivo. Science. 1962;137:499–508. - PubMed
    1. Warburg O, Dickens F, Kaiser Wilhelm-Institut für Biologie, B . The metabolism of tumours: Investigations from the Kaiser-Wilhelm Institute for Biology. Berlin-Dahlem. London: Constable; 1930.
    1. Gatenby RA, Gillies RJ. Why do cancers have high aerobic glycolysis? Nature Reviews Cancer. 2004;4:891–899. - PubMed

Publication types

MeSH terms