. 2009 Mar 3;7(3):e60.
doi: 10.1371/journal.pbio.1000060.

Rictor/TORC2 regulates Caenorhabditis elegans fat storage, body size, and development through sgk-1

Affiliations

Rictor/TORC2 regulates Caenorhabditis elegans fat storage, body size, and development through sgk-1

Kevin T Jones et al. PLoS Biol. .

Abstract

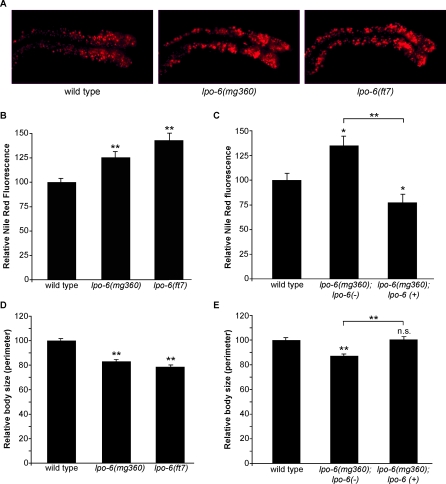
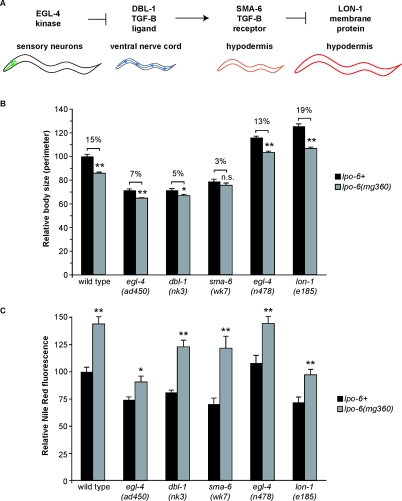
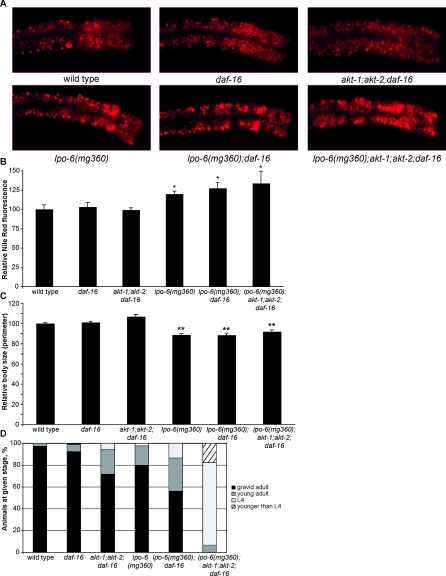
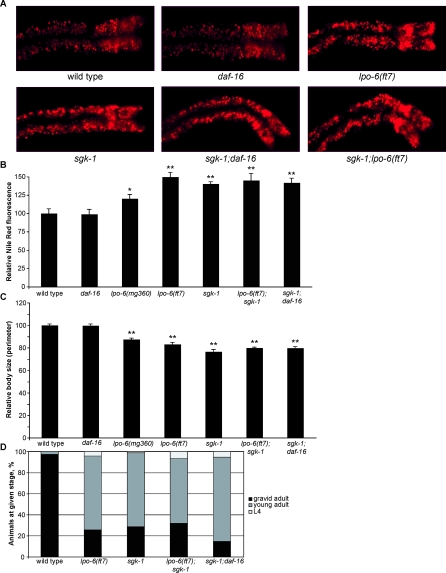
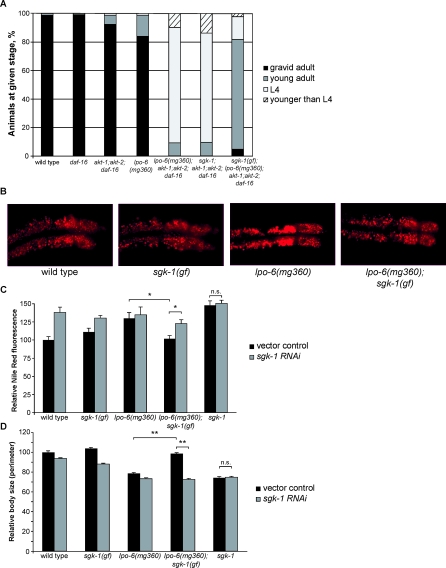
The target of rapamycin (TOR) kinase coordinately regulates fundamental metabolic and cellular processes to support growth, proliferation, survival, and differentiation, and consequently it has been proposed as a therapeutic target for the treatment of cancer, metabolic disease, and aging. The TOR kinase is found in two biochemically and functionally distinct complexes, termed TORC1 and TORC2. Aided by the compound rapamycin, which specifically inhibits TORC1, the role of TORC1 in regulating translation and cellular growth has been extensively studied. The physiological roles of TORC2 have remained largely elusive due to the lack of pharmacological inhibitors and its genetic lethality in mammals. Among potential targets of TORC2, the pro-survival kinase AKT has garnered much attention. Within the context of intact animals, however, the physiological consequences of phosphorylation of AKT by TORC2 remain poorly understood. Here we describe viable loss-of-function mutants in the Caenorhabditis elegans homolog of the TORC2-specific component, Rictor (CeRictor). These mutants display a mild developmental delay and decreased body size, but have increased lipid storage. These functions of CeRictor are not mediated through the regulation of AKT kinases or their major downstream target, the insulin-regulated FOXO transcription factor DAF-16. We found that loss of sgk-1, a homolog of the serum- and glucocorticoid-induced kinase, mimics the developmental, growth, and metabolic phenotypes of CeRictor mutants, while a novel, gain-of-function mutation in sgk-1 suppresses these phenotypes, indicating that SGK-1 is a mediator of CeRictor activity. These findings identify new physiological roles for TORC2, mediated by SGK, in regulation of C. elegans lipid accumulation and growth, and they challenge the notion that AKT is the primary effector of TORC2 function.


Conflict of interest statement

Competing interests. The authors have declared that no competing interests exist.

Figures

Figure 1
Figure 1. Loss of CeRictor Causes Increased Lipid Storage and Decreased Body Size
(A) Images of Nile Red staining of lipids in anterior intestinal cells of adult wild-type, lpo-6 (mg360), and lpo-6 (ft7) strains. Representative images are shown. In each image, anterior of the animal is to the right. (B) Quantification of Nile Red staining. Mean fluorescence intensity is reported as a percentage of the mean for wild-type animals (error bars indicate s.e.m.). Single asterisk indicates a p-value < 0.05, and double asterisk indicates p-value <0.01 (wild type versus mutant, two-tailed t-test, n = 5–7). (C) Quantification of Nile Red staining. Mean fluorescence intensity is reported as a percentage of the mean for wild-type animals (error bars indicate s.e.m.). Single asterisk indicates a p-value ≤ 0.05, and double asterisk indicates p-value < 0.01 (wild type versus mutant, two-tailed t-test, n = 5–8). lpo-6 (+) and (-) refer to the presence or absence of wild-type CeRictor transgene. (D) Quantification of body size measurements. The perimeter of each worm was measured. Values reported as mean size as a percentage of mean for wild type (error bars indicate s.e.m.). Double asterisk indicates p-value < 0.01 (wild type versus mutant strain, two-tailed t-test, n = 10). (E) Quantification of body size measurements. The perimeter of each worm was measured. Values reported as mean size as a percentage of mean for wild type (error bars indicate s.e.m.). Double asterisk indicates p-value < 0.01 (wild type versus mutant strain, two-tailed t-test, n = 10). lpo-6 (+) and (-) refer to the presence or absence of wild-type CeRictor transgene. Body size of rescued lpo-6 mutants (lpo-6 (mg360); lpo-6 (+)) is not significantly different from wild-type animals (p-value = 0.88, two-tailed t-test, n = 10).
Figure 2
Figure 2. CeRictor Regulates Size Independent of the dbl-1 Pathway
(A) Genetic regulatory hierarchy of the dbl-1-mediated body size pathway. Molecular function, expression pattern, and representation of null phenotype for each component are indicated. (B) Quantification of body size measurements. The perimeter of each worm was measured. Sizes are reported as percentage of wild type (error bars indicate s.e.m). For each gene, sizes of both mutant strain alone (black bars) and mutant strain also harboring the lpo-6 (mg360) mutation (gray bars) are shown. Asterisks indicate significance of difference between single mutant and lpo-6 (mg360);mutant strain; single asterisk indicates p-value < 0.05 and double asterisk indicates p-value < 0.01 (two-tailed t-test, n = 10–20 per strain). sma-6 (wk7) and sma-6 (wk7);lpo-6 (mg360) are not significantly different (two-tailed t-test, p = 0.24). Percentages above bars represent the percent reduction in lpo-6 (mg360); mutant strain as compared to mutant strain alone (percentage refers to size as a percentage of wild type). (C) Quantification of Nile Red staining. Mean fluorescence intensity is reported as a percentage of the mean for wild-type animals (error bars indicate s.e.m.). For each gene, sizes of both mutant strain alone (black bars) and mutant strain also harboring the lpo-6 (mg360) mutation (gray bars) are shown. Asterisks indicate significance of difference between single mutant and lpo-6 (mg360); mutant strain; single asterisk indicates p-value < 0.05, and double asterisk indicates p-value < 0.01 (two-tailed t-test, n = 5–7 per strain). As indicated in Materials and Methods, the reported values for fat correspond to Nile Red fluorescence within the first three pairs of intestinal cells without adjustment for differences in cell size between mutants.
Figure 3
Figure 3. Inactivation of CeRictor Does Not Affect Feeding Rate but Is Required for Normal Reproduction
(A) Total number of progeny was counted for individual wild-type or lpo-6 (mg360) animals (n = 10 per strain). Average brood sizes are expressed as a percentage of wild type (error bars indicate s.e.m.). Double asterisk indicates p-value < 0.01(two-tailed t-test). (B) Feeding rate (pharyngeal pumping) was measured in lpo-6 (mg360) and wild-type animals (n = 20 for each strain). Average rate is expressed as a percentage of wild type (error bars indicate s.e.m.). Strains were measured as well-fed adults. Wild-type and lpo-6 (mg360) animals are not significantly different (p = 0.14, two-tailed t-test).
Figure 4
Figure 4. CeRictor Regulation of Lipid Storage, Size, and Development Is Independent of Akt and FOXO Function
(A) Images of Nile Red staining of lipids in anterior intestinal cells. (B) Quantification of Nile Red staining. Mean fluorescence intensity is reported as a percentage of the mean for wild-type animals (error bars indicate s.e.m.). Asterisk indicates p-value < 0.05 (wild type versus mutant, two-tailed t-test, n = 4–5). lpo-6 (mg360);daf-16 and lpo-6 (mg360);akt-1;akt-2;daf-16 are not significantly different from lpo-6 (mg360) (two-tailed t-tests, p-values for both comparisons are 0.44). (C) Quantification of body size. Values are reported as mean size as a percentage of mean for wild type (error bars indicate s.e.m.). Double asterisk indicates p-value < 0.01 (wild type versus mutant strain, two-tailed t-test, n = 10). lpo-6 (mg360);daf-16 and lpo-6 (mg360);akt-1;akt-2;daf-16 are not significantly different from lpo-6 (mg360) (two-tailed t-test, p-values are 0.84 and 0.12, respectively). (D) Developmental timing of mutant strains. Animals were grown from synchronized L1s for 72 h at 20 °C; individuals were then scored for developmental stage. Fifty nine–156 animals were used for each strain.
Figure 5
Figure 5. CeRictor and sgk-1 Define a Single Regulatory Pathway Governing Fat Storage, Body Size, and Developmental Rate
(A) Images of Nile Red staining of lipids in anterior intestinal cells. (B) Quantification of Nile Red staining. Mean fluorescence intensity is reported as a percentage of the mean for wild-type animals (error bars indicate s.e.m.). Single asterisk indicates p-value < 0.05, and double asterisk indicates p-value < 0.01 (wild type versus mutant, two-tailed t-test, n = 5–6). lpo-6 (ft7) is not significantly different from sgk-1 (two-tailed t-test, p-value = 0.20). sgk-1 does not statistically differ from sgk-1;lpo-6 (ft7) or sgk-1;daf-16 (two-tailed t-tests, p-values = 0.63 and 0.81, respectively). (C) Quantification of body size. Values reported as mean size as a percentage of mean for wild type (error bars indicate s.e.m.). Double asterisk indicates p-value < 0.01 (wild type versus mutant strain, two-tailed t-test, n = 10). sgk-1 does not statistically differ from sgk-1;lpo-6 (ft7) or sgk-1;daf-16 (two-tailed t-tests, p-values = 0.11 and 0.14, respectively). (D) Developmental timing of mutant strains. Animals were grown from synchronized L1s for 72 h at 20 °C; individuals were then scored for developmental stage. Sixty–185 animals were used for each strain.
Figure 6
Figure 6. A Gain-of-Function Mutation in sgk-1 Suppresses the Fat Storage, Body Size, and Developmental Phenotypes of lpo-6 (mg360)
(A) Developmental timing of mutant strains. Animals were grown from synchronized L1s for 72 h at 20 °C; individuals were then scored for developmental stage. Sixty–185 animals were used for each strain. One hundred and six–181 animals were used for each strain. In all panels of this figure, sgk-1 (gf) refers to the described sgk-1 (ft15) allele, and sgk-1 refers to the null deletion allele, sgk-1 (ok538). (B) Images of Nile Red staining of lipids in anterior intestinal cells. (C) Quantification of Nile Red staining. Mean fluorescence intensity is reported as a percentage of the mean for wild type or vector control (error bars indicate s.e.m.). Asterisk indicates p-value < 0.05 (lpo-6 (mg360);sgk-1 (gf) grown on vector control versus sgk-1 RNAi, or lpo-6 (mg360) grown on vector control versus lpo-6 (mg360);sgk-1 (gf) grown on vector control, two-tailed t-test, n = 5–6). sgk-1 grown on vector control does not differ significantly from sgk-1 grown on sgk-1 RNAi (two-tailed t-test, p-value = 0.77). (D) Quantification of body size. Values reported as mean size as a percentage of mean for wild type on vector control (error bars indicate s.e.m.). Double asterisk indicates p-value < 0.01 (lpo-6 (mg360);sgk-1 (gf) grown on vector control versus sgk-1 RNAi, or lpo-6 (mg360) grown on vector control versus lpo-6 (mg360);sgk-1 (gf) grown on vector control, two-tailed t-test, n = 10). sgk-1 grown on vector control does not differ significantly from sgk-1 grown on sgk-1 RNAi (two-tailed t-test, p-value = 0.89).

Similar articles

Cited by

References

    1. Wullschleger S, Loewith R, Hall MN. TOR signaling in growth and metabolism. Cell. 2006;124:471–484. - PubMed
    1. Tsang CK, Qi H, Liu LF, Zheng XF. Targeting mammalian target of rapamycin (mTOR) for health and diseases. Drug Discov Today. 2007;12:112–124. - PubMed
    1. Loewith R, Jacinto E, Wullschleger S, Lorberg A, Crespo JL, et al. Two TOR complexes, only one of which is rapamycin sensitive, have distinct roles in cell growth control. Mol Cell. 2002;10:457–468. - PubMed
    1. Hara K, Maruki Y, Long X, Yoshino K, Oshiro N, et al. Raptor, a binding partner of target of rapamycin (TOR), mediates TOR action. Cell. 2002;110:177–189. - PubMed
    1. Kim DH, Sarbassov DD, Ali SM, King JE, Latek RR, et al. mTOR interacts with raptor to form a nutrient-sensitive complex that signals to the cell growth machinery. Cell. 2002;110:163–175. - PubMed

Publication types

MeSH terms

Substances