

doi: 10.1126/scisignal.2000016.
Odor coding by a Mammalian receptor repertoire
Affiliations
- PMID: 19261596
- PMCID: PMC2774247
- DOI: 10.1126/scisignal.2000016
Item in Clipboard
Odor coding by a Mammalian receptor repertoire
Sci Signal.
.
Abstract
Deciphering olfactory encoding requires a thorough description of the ligands that activate each odorant receptor (OR). In mammalian systems, however, ligands are known for fewer than 50 of more than 1400 human and mouse ORs, greatly limiting our understanding of olfactory coding. We performed high-throughput screening of 93 odorants against 464 ORs expressed in heterologous cells and identified agonists for 52 mouse and 10 human ORs. We used the resulting interaction profiles to develop a predictive model relating physicochemical odorant properties, OR sequences, and their interactions. Our results provide a basis for translating odorants into receptor neuron responses and for unraveling mammalian odor coding.
Figures
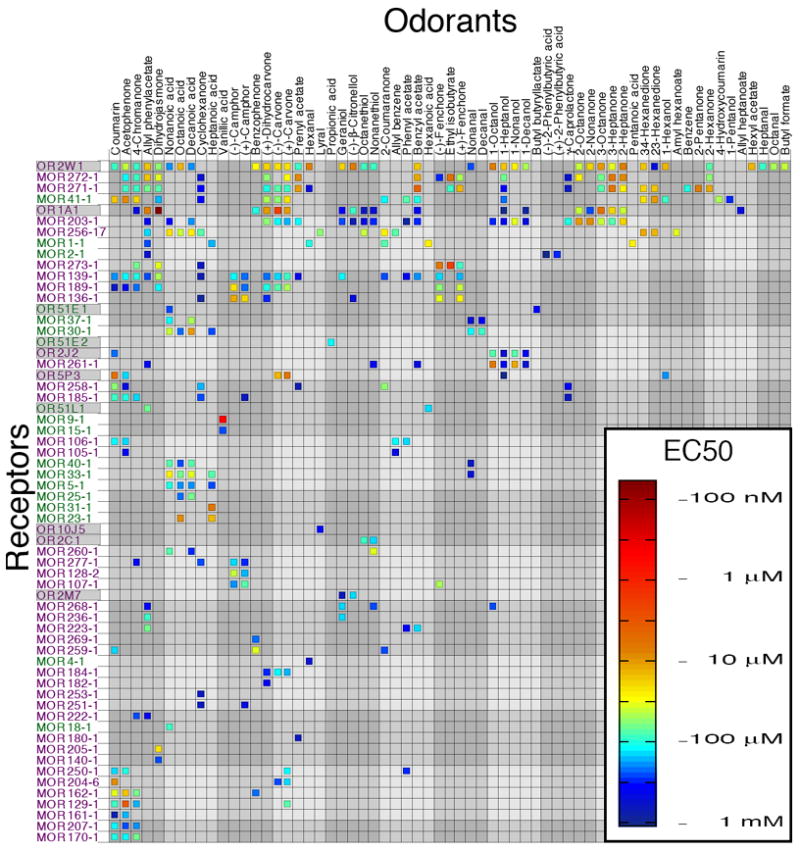
EC50 values for 62 odorant receptors and 63 odorants. Class I receptors are shown in green, class II receptors in purple. Human odorant receptors have a gray background. Odorant and receptor order were determined independently by cluster analysis using the receptor response data such that the most similar odorants (and receptors) are next to each other on their respective axes. A second version of this figure, with odorant order determined by functional group and receptor order determined by number of agonists is included for comparison (see Fig. S10).
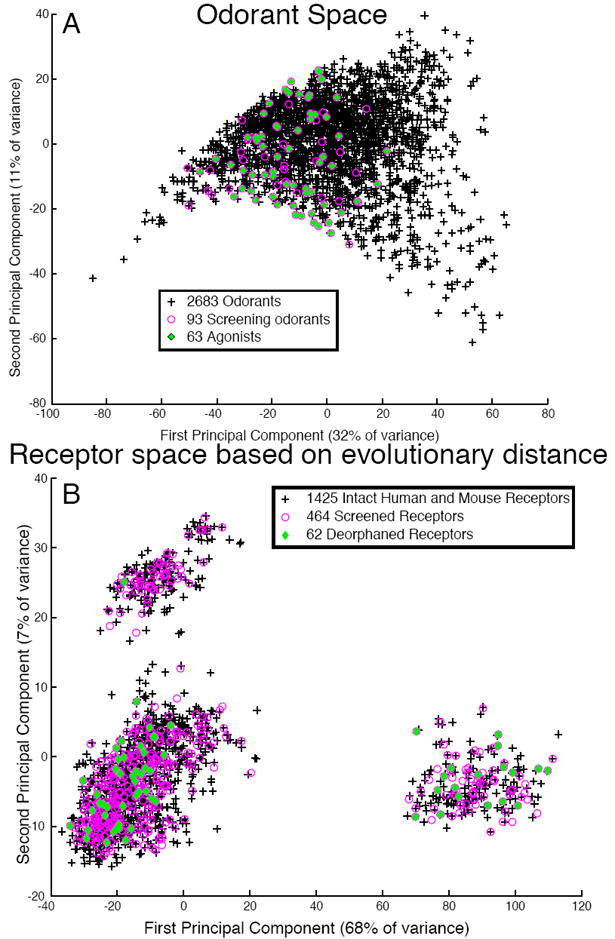
Bias in odorant and receptor sampling. (A) Odorant space. 1664 chemical descriptors were calculated for 2683 odorants. The odorants were projected onto a 2-dimensional space made of the first and second principal components. Odorants used in the mixture-screening phase are colored in magenta; odorants found to bind at least one receptor are shown in green. Black crosses represent untested odorants. (B) Receptor space. The Jukes-Cantor algorithm was used to calculate a distance matrix for 1425 intact odorant receptors. The matrix was visualized in two dimensions using principal component analysis. Receptors used in the mixture screening phase are colored in magenta, receptors deorphaned in this study are shown in green. Black crosses represent untested receptors.
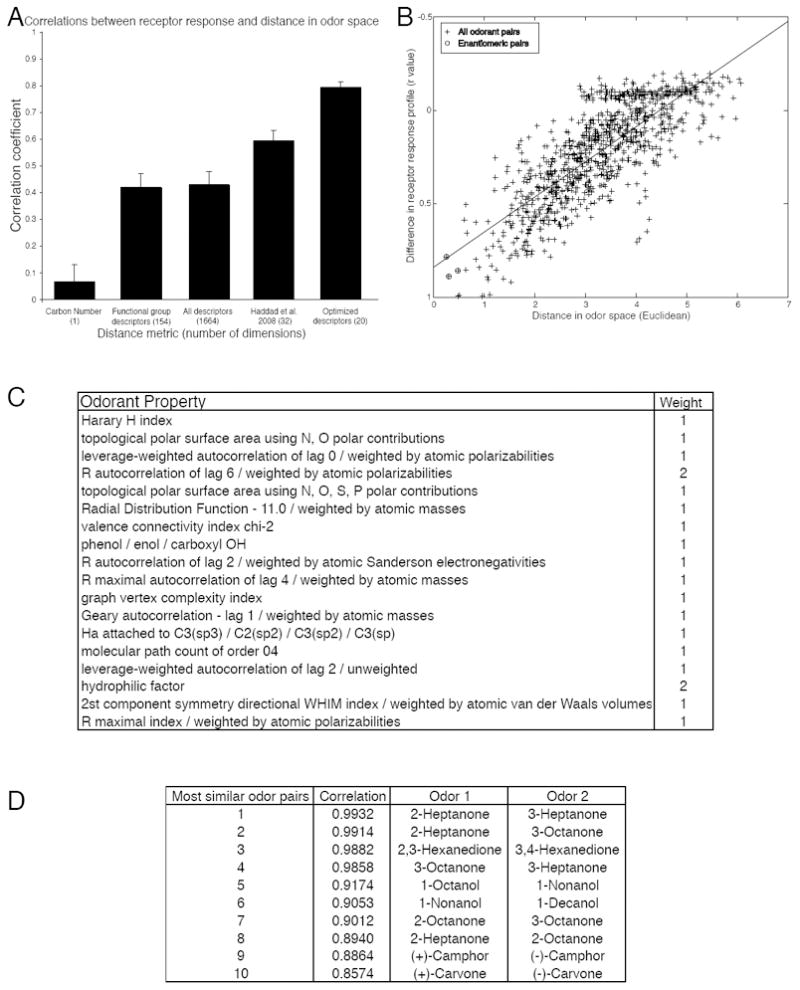
Distance in odorant space predicts similarity in receptor response. (A) Testing various odorant-similarity metrics against the functional data. (B) The difference in the receptor response profile is correlated with the distance between the two odorants calculated using 20 optimized descriptors (r = 0.79, p < 0.001). Enantiomeric pairs are circled. The absence of any completely non-correlated odorant pairs is due to the fact that all pairs of odorants have at least one receptor in common which was not activated by either odorant. (C) 18 physicochemical descriptors that explain over 62% of the variance in our dataset. Definitions of how the descriptors are calculated can be found in the Handbook of Molecular Descriptors (65). (D) The top ten most similar odorant pairs according to our assay. The second column is the Pearson correlation coefficient between the two odorant-response vectors represented in Fig. 1.
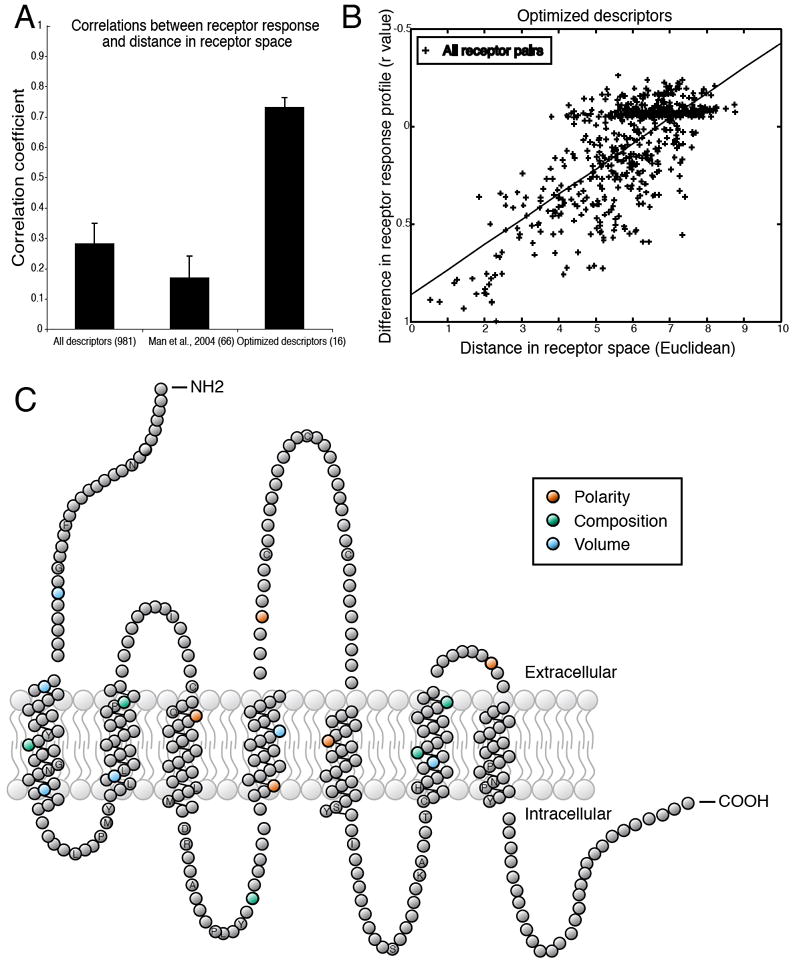
Distance in receptor space predicts similarity in responses to odorants. (A) Testing various receptor-similarity metrics against the functional data shows that our optimized descriptors predict functional responses better than full-sequence similarity or similarity at previously suggested residues (34). (B) Differences in the odorant response profiles of two receptors are correlated with distances between the same receptors, calculated using 16 optimized descriptors (r = 0.73, p < 0.001). Each point represents one pair of receptors. The absence of any completely non-correlated receptor pairs is due to the fact that all pairs of receptors have at least one odorant in common which fails to activate both receptors. (C) Snake plot of a typical OR in which amino acid residues with ligand-specificity-determining properties are highlighted. Residue properties selected by the greedy optimization algorithm are indicated by color. Amino acid positions conserved in at least 90% of the 1425 receptors are labeled with their single-letter amino acid code. Abbreviations for the amino acid residues are as follows: A, Ala; C, Cys; D, Asp; F, Phe; G, Gly; H, His; I, Ile; K, Lys; L, Leu; M, Met; N, Asn; P, Pro; Q, Gln; R, Arg; S, Ser; T, Thr; and Y, Tyr.
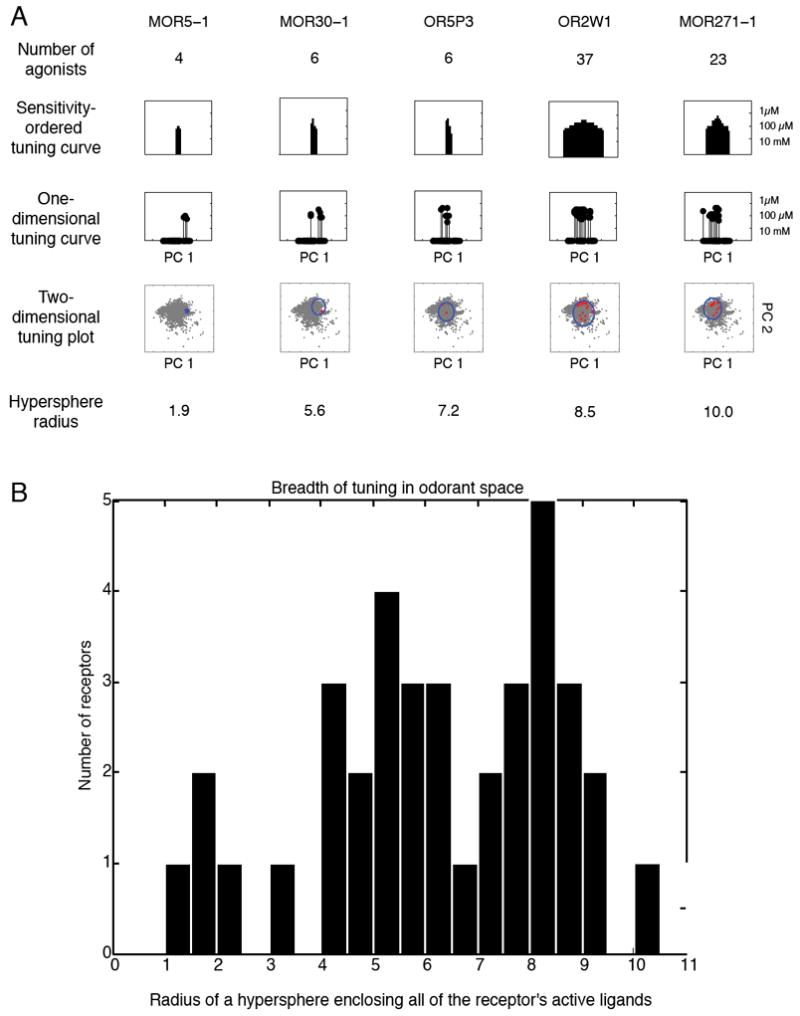
Breadth of tuning in odorant space. A) Table of assorted breadth of tuning representations. The sensitivity-ordered tuning curve displays the 63 tested odorants on the x-axis ordered according to their EC50 for the given receptor. Odorants that activated the receptor at the lowest concentrations are placed near the center of the distribution, whereas those that did not elicit a response are placed at the edges of the distribution. The order of odorants is thus different for different receptors. The one-dimensional tuning curves are stem-plot versions of the sensitivity-ordered tuning curves with the x-axis representing the value of the odorant along the first principal component of Haddad et al.’s odorant space (31). The 2D odorant space figure retains the x-axis of the 1D odorant space figure, but plots the value of the odorant along the second principal component of Haddad et al.’s odorant space on the y-axis, thus forming a 2D projection of odorant space. 2683 odorants are plotted in grey. The odorants activating the receptor are plotted in red and a circle circumscribing the odorants is plotted in blue. The final row is the radius of a hypersphere that encloses all of the receptor’s agonists in the 32-dimensional odorant space. B) A histogram of the hypersphere radius measure for all 62 receptors. For comparison, a hypersphere enclosing 2,683 odorants (listed in Supplementary Table 5) has a radius of 26; a hypersphere enclosing the 93 odorants in our test set has a radius of 14; a hypersphere enclosing the 63 odorants that activated at least one receptor has a radius of 12.
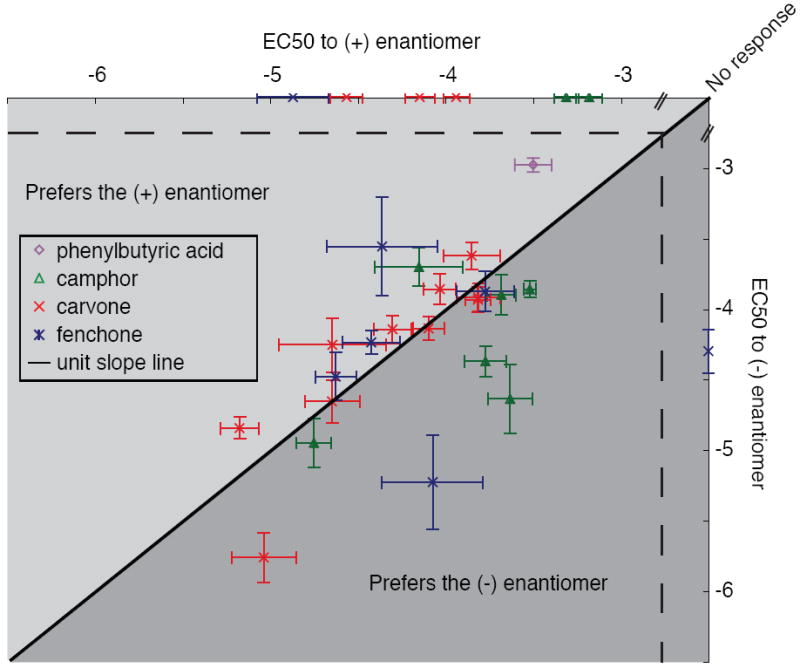
Responses of olfactory receptors to enantiomeric pairs. All receptors that responded to at least one member of the 4 tested enantiomeric pairs are plotted. The black line represents the unit slope line. Points that fall above the line represent receptors more sensitive to the (+) enantiomer, points below the line represent receptors more sensitive to the (-) enantiomer. Error bars represent standard error.
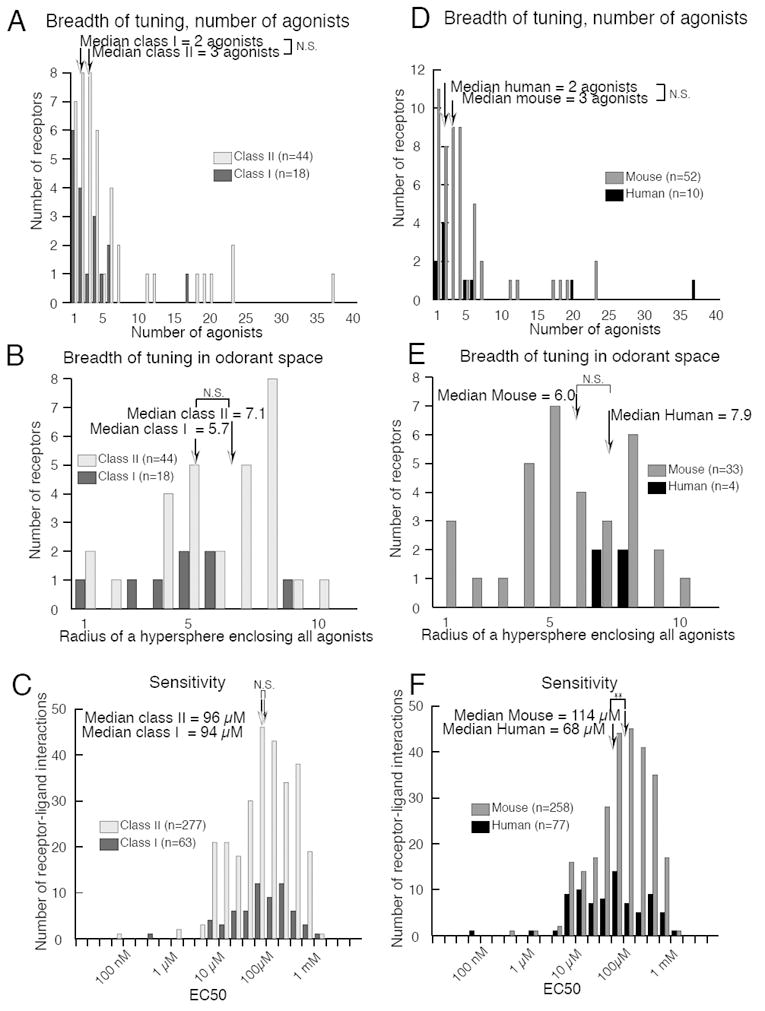
Receptor comparisons by classification. Breadth of tuning did not differ between Class I and Class II receptors by either (A) number of agonists or (B) coverage of odorant space. (C) Sensitivity did not differ between Class I and Class II receptors. Breadth of tuning did not differ between human and mouse receptors by either (D) number of agonists or (E) distance in odorant space. (F) Human receptors were significantly more sensitive to odorants than mouse receptors (p < 0.008).
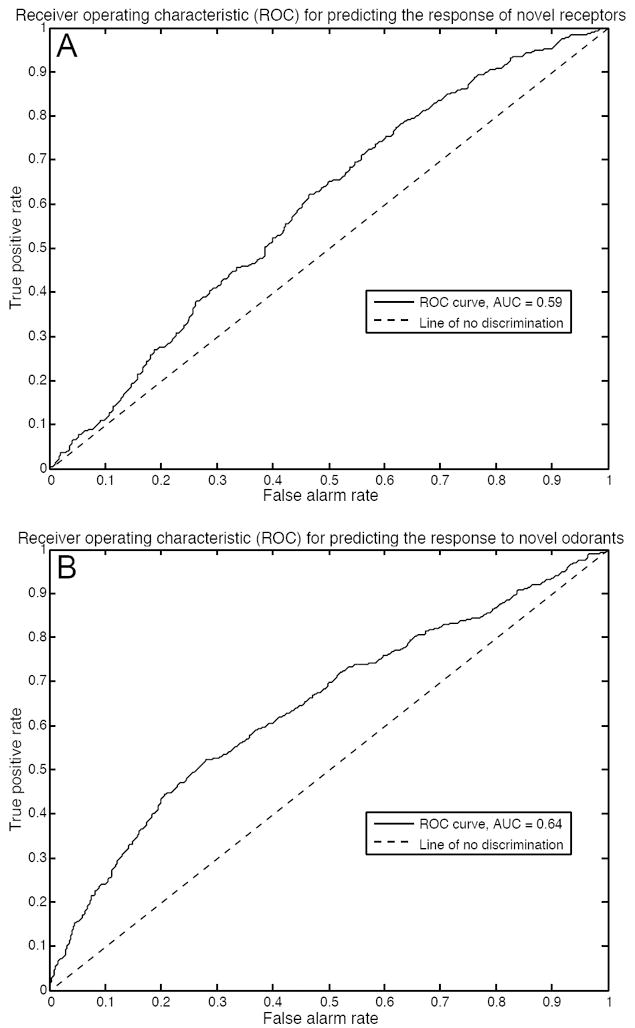
Receiver operating characteristic curves for our ligand-receptor interaction classifier. (A) Validation of our model when predicting the response of novel receptors to tested odorants. The area under the curve indicates that our model successfully predicts if a tested odorant is an agonist of a novel receptor 59% of the time. (B) Validation of our model when predicting the response of tested receptors to novel odorants. The area under the curve indicates that our model successfully predicts if a novel odorant is an agonist of a tested receptor 64% of the time.
References
-
- Buck L, Axel R. A novel multigene family may encode odorant receptors: a molecular basis for odor recognition. Cell. 1991;65:175–87. - PubMed
-
- Niimura Y, Nei M. Evolutionary changes of the number of olfactory receptor genes in the human and mouse lineages. Gene. 2005;346:23–8. - PubMed
-
- Healy MD, Smith JE, Singer MS, Nadkarni PM, Skoufos E, Miller PL, Shepherd GM. Olfactory receptor database (ORDB): a resource for sharing and analyzing published and unpublished data. Chemical Senses. 1997;22:321–6. - PubMed
-
- Zhang X, Firestein S. The olfactory receptor gene superfamily of the mouse. Nat Neurosci. 2002;5:124–33. - PubMed
-
- Lander ES, Linton LM, Birren B, Nusbaum C, Zody MC, Baldwin J, Devon K, Dewar K, Doyle M, FitzHugh W, Funke R, Gage D, Harris K, Heaford A, Howland J, Kann L, Lehoczky J, LeVine R, McEwan P, McKernan K, Meldrim J, Mesirov JP, Miranda C, Morris W, Naylor J, Raymond C, Rosetti M, Santos R, Sheridan A, Sougnez C, Stange-Thomann N, Stojanovic N, Subramanian AD, Wyman A, Rogers J, Sulston J, Ainscough R, Beck S, Bentley D, Burton J, Clee C, Carter N, Coulson A, Deadman R, Deloukas P, Dunham A, Dunham I, Durbin R, French L, Grafham D, Gregory S, Hubbard T, Humphray S, Hunt A, Jones M, Lloyd C, McMurray A, Matthews L, Mercer S, Milne S, Mullikin JC, Mungall A, Plumb R, Ross M, Shownkeen R, Sims S, Waterston RH, Wilson RK, Hillier LW, McPherson JD, Marra MA, Mardis ER, Fulton LA, Chinwalla AT, Pepin KH, Gish WR, Chissoe SL, Wendl MC, Delehaunty KD, Miner TL, Delehaunty A, Kramer JB, Cook LL, Fulton RS, Johnson DL, Minx PJ, Clifton SW, Hawkins T, Branscomb E, Predki P, Richardson P, Wenning S, Slezak T, Doggett N, Cheng JF, Olsen A, Lucas S, Elkin C, Uberbacher E, Frazier M, Gibbs RA, Muzny DM, Scherer SE, Bouck JB, Sodergren EJ, Worley KC, Rives CM, Gorrell JH, Metzker ML, Naylor SL, Kucherlapati RS, Nelson DL, Weinstock GM, Sakaki Y, Fujiyama A, Hattori M, Yada T, Toyoda A, Itoh T, Kawagoe C, Watanabe H, Totoki Y, Taylor T, Weissenbach J, Heilig R, Saurin W, Artiguenave F, Brottier P, Bruls T, Pelletier E, Robert C, Wincker P, Smith DR, Doucette-Stamm L, Rubenfield M, Weinstock K, Lee HM, Dubois J, Rosenthal A, Platzer M, Nyakatura G, Taudien S, Rump A, Yang H, Yu J, Wang J, Huang G, Gu J, Hood L, Rowen L, Madan A, Qin S, Davis RW, Federspiel NA, Abola AP, Proctor MJ, Myers RM, Schmutz J, Dickson M, Grimwood J, Cox DR, Olson MV, Kaul R, Raymond C, Shimizu N, Kawasaki K, Minoshima S, Evans GA, Athanasiou M, Schultz R, Roe BA, Chen F, Pan H, Ramser J, Lehrach H, Reinhardt R, McCombie WR, de la Bastide M, Dedhia N, Blocker H, Hornischer K, Nordsiek G, Agarwala R, Aravind L, Bailey JA, Bateman A, Batzoglou S, Birney E, Bork P, Brown DG, Burge CB, Cerutti L, Chen HC, Church D, Clamp M, Copley RR, Doerks T, Eddy SR, Eichler EE, Furey TS, Galagan J, Gilbert JG, Harmon C, Hayashizaki Y, Haussler D, Hermjakob H, Hokamp K, Jang W, Johnson LS, Jones TA, Kasif S, Kaspryzk A, Kennedy S, Kent WJ, Kitts P, Koonin EV, Korf I, Kulp D, Lancet D, Lowe TM, McLysaght A, Mikkelsen T, Moran JV, Mulder N, Pollara VJ, Ponting CP, Schuler G, Schultz J, Slater G, Smit AF, Stupka E, Szustakowski J, Thierry-Mieg D, Thierry-Mieg J, Wagner L, Wallis J, Wheeler R, Williams A, Wolf YI, Wolfe KH, Yang SP, Yeh RF, Collins F, Guyer MS, Peterson J, Felsenfeld A, Wetterstrand KA, Patrinos A, Morgan MJ, de Jong P, Catanese JJ, Osoegawa K, Shizuya H, Choi S, Chen YJ. Initial sequencing and analysis of the human genome. Nature. 2001;409:860–921. - PubMed
MeSH terms
Substances
Grants and funding
LinkOut - more resources
Full Text Sources
Other Literature Sources
Research Materials
