. 2009 Apr 24;284(17):11663-75.
doi: 10.1074/jbc.M809374200. Epub 2009 Mar 4.

The Cul3/Klhdc5 E3 ligase regulates p60/katanin and is required for normal mitosis in mammalian cells

Affiliations

The Cul3/Klhdc5 E3 ligase regulates p60/katanin and is required for normal mitosis in mammalian cells

Cristina M Cummings et al. J Biol Chem. .

Abstract

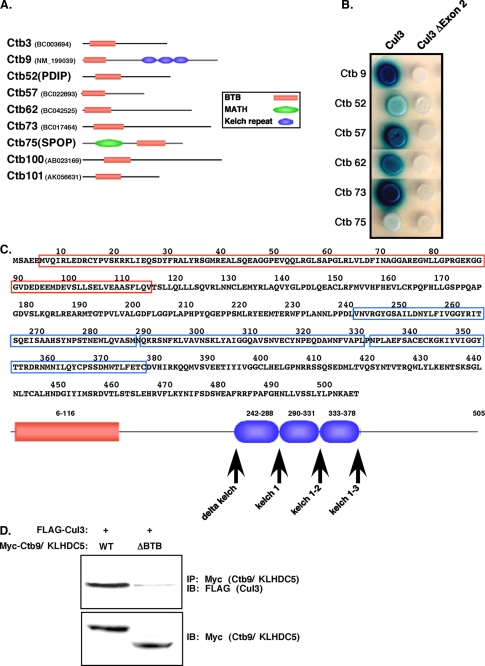
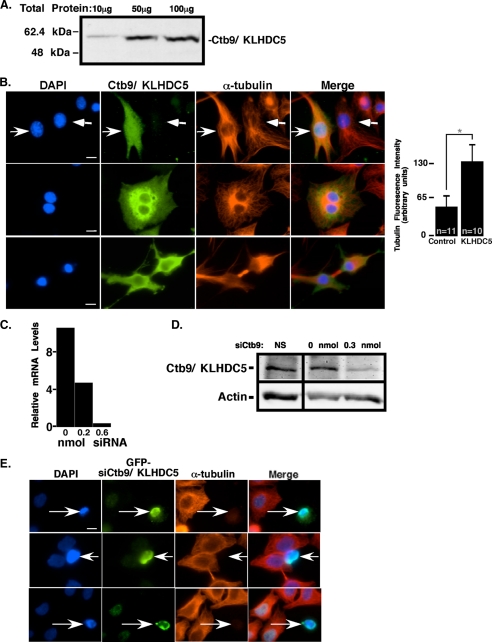
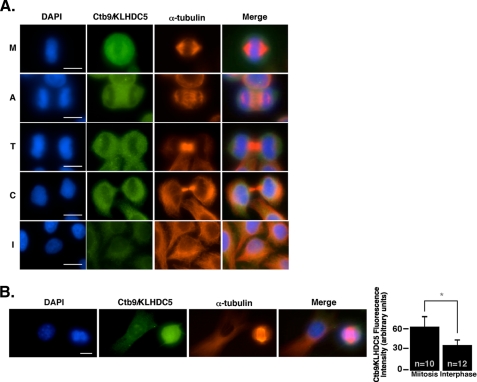
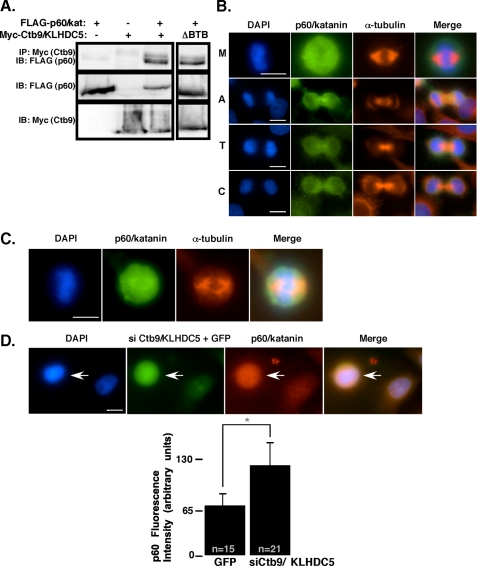
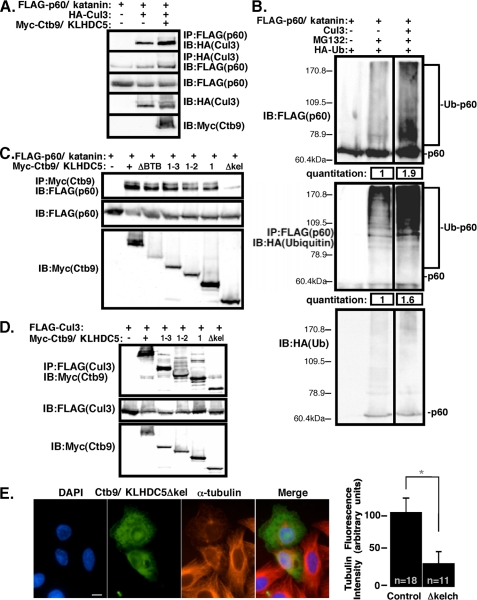
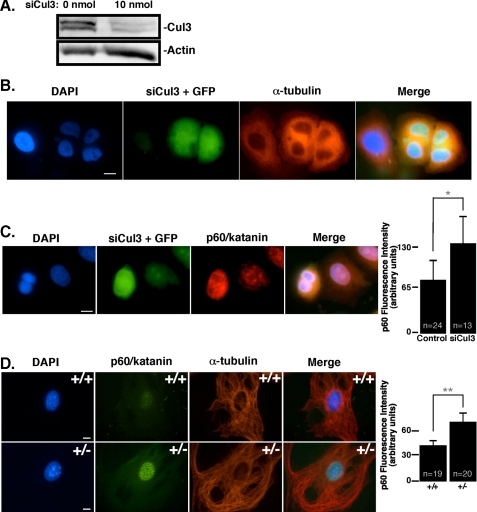
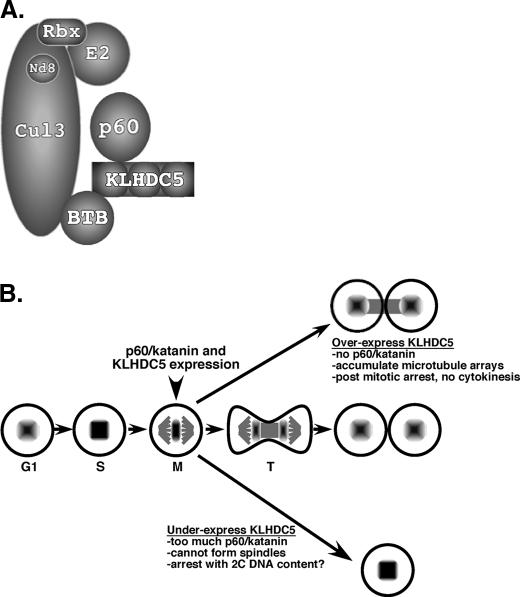
The proper regulation of factors involved in mitosis is crucial to ensure normal cell division. Levels and activities of proteins are regulated in many ways, one of which is ubiquitin-mediated protein degradation. E3 ubiquitin ligases are involved in targeting specific substrates for degradation by facilitating their ubiquitination. In seeking to elucidate additional biological roles for Cul3 we performed a two-hybrid screen and identified Ctb9/KLHDC5 as a Cul3-interacting protein. Overexpression of Ctb9/KLHDC5 resulted in an increase in microtubule density as well as persistent microtubule bridges between post-mitotic cells. Conversely, down-regulation of Ctb9/KLHDC5 showed a pronounced reduction in microtubule density. Based on these observations, we examined the interactions between Cul3, Ctb9/KLHDC5, and the microtubule-severing protein, p60/katanin. Here we show that p60/katanin interacts with a complex consisting of Cul3 and Ctb9/KLHDC5, which results in ubiquitin laddering of p60/katanin. Also, Cul3-deficient cells or Ctb9/KLHDC5-deficient cells show an increase in p60/katanin levels, indicating that Cul3/Ctb9/KLHDC5 is required for efficient p60/katanin removal. We demonstrate a novel regulatory mechanism for p60/katanin that occurs at the level of targeted proteolysis to allow normal mitotic progression in mammalian cells.


Figures

FIGURE 1.
FIGURE 1.
Cul3 interacts with a variety of BTB domain-containing proteins. A, nine proteins containing a BTB domain were cloned from a yeast two-hybrid screen using Cul3 as bait. These Cul3-binding proteins (Ctbs) are depicted schematically with their conserved domains. Accession numbers are shown in parentheses. B, co-expression of several of the Ctbs with full-length Cul3 or Cul3Δexon 2 in yeast. Binding results in blue colonies. C, the amino acid sequence of Ctb9/KLHDC5 is shown, with the BTB domain highlighted in red, and kelch regions in blue. Below, is a schematic representation of Ctb9/KLHDC5, with arrows indicating the position of inserted stop codons. D, immunoprecipitation (IP) of Ctb9/KLHDC5 followed by immunoblot (IB) for Cul3 in HEK293 cells (top panel). Lower panel indicate expression levels of Ctb9/KLHDC5.
FIGURE 2.
FIGURE 2.
Ctb9/KLHDC5 regulates microtubule dynamics in mammalian cells. A, affinity-purified anti-Ctb9/KLHDC5 antibodies were tested for specificity by immunoblot. The amount of lysate used is indicated above each lane, and protein size in kilodaltons is shown to the left. B, HeLa cells transfected with Myc-tagged Ctb9/KLHDC5 are stained with DAPI (blue), Myc (green), and α-tubulin (red) antibodies and visualized by immunofluorescence. Right facing arrows indicate cells that are overexpressing Ctb9/KLHDC5, and left facing arrows indicate cells that are not. Bar graph shows relative levels of α-tubulin in cells transfected with Ctb9/KLHDC5 versus cells transfected with a control vector. C, quantification of relative Ctb9/KLHDC5 mRNA levels as determined by quantitative real-time RT-PCR with addition of various amounts of siRNA targeted against Ctb9/KLHDC5. NS is a non-targeting siRNA used as a negative control. D, immunoblots for Ctb9/KLHDC5 in untreated HeLa cells compared with those treated with siCtb9. Actin blots below verify equal loading of lysates. E, HeLa cells co-transfected with 0.3 nmol of siCtb9/KLHDC5 and GFP stained with DAPI, GFP (green), and α-tubulin (red). Arrows indicate cells that received siRNA. Two independent siRNAs targeted against Ctb9/KLHDC5 were used. The upper two sets of panels depict cells treated with siRNA (1) and lower panels with siRNA (2). Control siRNA showed no change in tubulin staining (not shown). The size bar indicates 10 μm (*, p < 0.0001).
FIGURE 3.
FIGURE 3.
Ctb9/KLHDC5 is expressed predominantly in mitotic cells. A, untransfected HeLa cells are immunostained with DAPI (blue), anti-Ctb9/KLHDC5 (green), and α-tubulin (red) during various mitotic stages to reveal the expression pattern for endogenous Ctb9/KLHDC5. Each stage of the cell cycle is indicated as follows: M (metaphase), A (anaphase), T (telophase), C (cytokinesis), and I (interphase). B, immunofluorescence showing endogenous Ctb9/KLHDC5 expression in NIH3T3 cells. The size bar indicates 10 μm. Quantification of Ctb9/KLHDC5 immunofluorescence staining intensity in mitotic versus interphase cells where n indicates the number of cells quantified (graph on right) (*, p = 0.0004).
FIGURE 4.
FIGURE 4.
p60/katanin is also expressed in mitotic cells and associates with Ctb9/KLHDC5. A, HEK293 cells were transfected with FLAG-tagged p60/katanin, Myc-tagged Ctb9, or both FLAG-p60/katanin and Myc-Ctb9. Immunoprecipitation of Ctb9 (via the myc tag) followed by immunoblot for p60/katanin (FLAG) is shown in the upper panel to indicate protein interactions. On the right, a Ctb9 mutant construct lacking the BTB domain has been co-expressed with p60/katanin. The middle and lower panels show protein expression levels. B, expression of endogenous p60/katanin in untransfected HeLa cells stained with DAPI (blue), anti-p60/katanin (green), and α-tubulin (red). Each stage of the cell cycle is indicated as follows: M (metaphase), A (anaphase), T (telophase), and C (cytokinesis). C, immunofluorescence showing endogenous p60/katanin expression in human embryonic lung fibroblasts stained as in B. D, HeLa cells were co-transfected with siCtb9/KLHDC5 and GFP. The arrow indicates the cell that received siCtb9/KLHDC5. Cells were stained with DAPI, and p60/katanin levels were assessed by immunofluorescence (shown in red). The size bar indicates 10 μm. p60/katanin immunofluorescence levels were quantified for control cells versus siCtb9 treated cells where n represents the number of cells assessed for quantification (*, p < 0.0001).
FIGURE 5.
FIGURE 5.
Cul3 facilitates ubiquitination of p60/katanin in mammalian cells. A, HEK293 cells co-transfected with FLAG-p60/katanin and HA-Cul3, with or without Myc-Ctb9/KLHDC5. The upper panel shows immunoprecipitation for p60/katanin followed by Cul3 immunoblot. The second panel shows p60/katanin immunoblot following Cul3 immunoprecipitation. The lower three sets of panels indicate protein expression levels. B, upper panel: immunoblot for FLAG-tagged p60/katanin in lysates from HEK293 cells co-transfected with HA-tagged ubiquitin and Cul3. MG132 was added to the cells where indicated above. Lower panel: the same lysates immunoprecipitated for p60 (FLAG) and blotted for HA (ubiquitin) to show the high molecular weight forms are ubiquitinated p60/katanin. Quantification of ubiquitinated p60/katanin levels are shown at the bottom. C, lysates from transfected HEK293 cells were immunoprecipitated with anti-Ctb9/KLHDC5 (Myc) antibody, followed by immunoblot for p60/katanin (FLAG, upper panel). p60/katanin was co-transfected with various Ctb9/KLHDC5 mutants (depicted in Fig. 1) to determine the region of Ctb9/KLHDC5 important for the interaction with p60/katanin. The middle and lower panels show protein expression levels for each of the transfected proteins. D, in HEK293 cells, FLAG-tagged Cul3 was co-transfected with Myc-tagged Ctb9/KLHDC5 kelch domain mutants to determine whether the kelch regions of Ctb9/KLHDC5 are important for its interaction with Cul3. In the upper panel, immunoprecipitation for Cul3 (FLAG) was followed by immunoblot for Ctb9/KLHDC5 (Myc). The middle and lower panels show relative protein expression levels. E, HeLa cells transfected with a Ctb9/KLHDC5 Δkelch mutant construct are immunostained for DAPI (blue), Ctb9/KLHDC5 (green), and α-tubulin (red). The cell size bar indicates 10 μm. Quantification of α-tubulin immunofluorescence levels in control cells versus cells transfected with Ctb9/KLHDC5 Δkelch mutant are shown at the right where n indicates the number of cells quantified (*, p < 0.0001).
FIGURE 6.
FIGURE 6.
Reduction of Cul3 expression increases p60/katanin levels. A, HeLa cells were treated with siRNA targeted against Cul3. The upper panel shows endogenous Cul3 protein levels by immunoblot in untreated versus siRNA-treated HeLa cells, whereas the lower panel indicates actin levels. B, immunofluorescence of HeLa cells co-transfected with siCul3 RNA and GFP showing DNA and microtubules as visualized by DAPI and α-tubulin staining, respectively. C, Cul3 siRNA-treated HeLa cells are stained for p60/katanin (red). Expression of GFP indicates cells that received the siRNA. p60/katanin fluorescence levels in control versus siCul3-treated cells are quantified to the right where n equals the number of cells quantified. D, MEFs were stained by immunofluorescence for endogenous p60/katanin (shown in green) to compare expression levels in cells with contrasting levels of Cul3. Cul3+/+ MEFs are shown in the upper panel, whereas Cul3+/- MEFs (Cul3 hypomorphs) are shown below. Microtubules are stained in red, and DAPI staining is in blue. Quantification of p60/katanin immunofluorescence levels is shown to the right. n indicates the number of cells quantified. The size bar depicts 10 μm (*, p = 0.0004; **, p < 0.0001).
FIGURE 7.
FIGURE 7.
A model for Cul3-mediated ubiquitination of p60/katanin. A, Cul3 serves as a scaffold, binding the E2 ubiquitin conjugating enzyme and the essential ring finger protein Rbx1. KLHDC5 binds to Cul3 via its BTB domain, and to p60/katanin through its kelch repeats, and recruits p60/katanin for ubiquitination by the Cul3 E3 ligase. B, stages of the cell cycle that depend on p60/katanin degradation. Both p60/katanin and Ctb9/KLHDC5 are expressed early in mitosis. In telophase (T) Ctb9/KLHDC5 expression is limited by an unknown mechanism and excluded from the midbody allowing accumulation of p60/katanin in the area of the midbody. Overexpression of Ctb9/KLHDC5 results in too little p60/katanin and a buildup of microtubules, which prevents completion of mitosis. Under-expression of Ctb9/KLHDC5 results in too much p60/katanin, which prevents microtubules from forming, and therefore prevents progression of mitosis.

Similar articles

Cited by

References

    1. Ciechanover, A., Heller, H., Katz-Etzion, R., and Hershko, A. (1981) Proc. Natl. Acad. Sci. U. S. A. 78 761-765 - PMC - PubMed
    1. Hershko, A., Ciechanover, A., and Rose, I. A. (1981) J. Biol. Chem. 256 1525-1528 - PubMed
    1. Hershko, A. (1983) Cell 34 11-12 - PubMed
    1. Bai, C., Sen, P., Hofmann, K., Ma, L., Goebl, M., Harper, J. W., and Elledge, S. J. (1996) Cell 86 263-274 - PubMed
    1. Lyapina, S. A., Correll, C. C., Kipreos, E. T., and Deshaies, R. J. (1998) Proc. Natl. Acad. Sci. U. S. A. 95 7451-7456 - PMC - PubMed

Publication types