. 2009 Apr 24;284(17):11454-66.
doi: 10.1074/jbc.M805933200. Epub 2009 Mar 3.

GEF-H1 mediates tumor necrosis factor-alpha-induced Rho activation and myosin phosphorylation: role in the regulation of tubular paracellular permeability

Affiliations

GEF-H1 mediates tumor necrosis factor-alpha-induced Rho activation and myosin phosphorylation: role in the regulation of tubular paracellular permeability

Eli Kakiashvili et al. J Biol Chem. .

Abstract

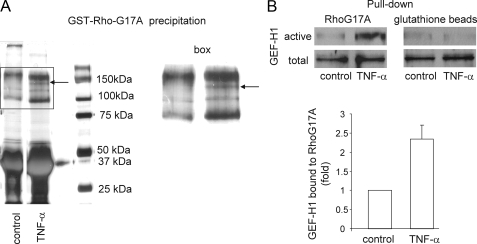
Tumor necrosis factor-alpha (TNF-alpha), an inflammatory cytokine, has been shown to activate the small GTPase Rho, but the underlying signaling mechanisms remained undefined. This general problem is particularly important in the kidney, because TNF-alpha, a major mediator of kidney injury, is known to increase paracellular permeability in tubular epithelia. Here we aimed to determine the effect of TNF-alpha on the Rho pathway in tubular cells (LLC-PK(1) and Madin-Darby canine kidney), define the upstream signaling, and investigate the role of the Rho pathway in the TNF-alpha-induced alterations of paracellular permeability. We show that TNF-alpha induced a rapid and sustained RhoA activation that led to stress fiber formation and Rho kinase-dependent myosin light chain (MLC) phosphorylation. To identify new regulators connecting the TNF receptor to Rho signaling, we applied an affinity precipitation assay with a Rho mutant (RhoG17A), which captures activated GDP-GTP exchange factors (GEFs). Mass spectrometry analysis of the RhoG17A-precipitated proteins identified GEF-H1 as a TNF-alpha-activated Rho GEF. Consistent with a central role of GEF-H1, its down-regulation by small interfering RNA prevented the activation of the Rho pathway. Moreover GEF-H1 and Rho activation are downstream of ERK signaling as the MEK1/2 inhibitor PD98059 mitigated TNF-alpha-induced activation of these proteins. Importantly TNF-alpha enhanced the ERK pathway-dependent phosphorylation of Thr-678 of GEF-H1 that was key for activation. Finally the TNF-alpha-induced paracellular permeability increase was absent in LLC-PK(1) cells stably expressing a non-phosphorylatable, dominant negative MLC. In summary, we have identified the ERK/GEF-H1/Rho/Rho kinase/phospho-MLC pathway as the mechanism mediating TNF-alpha-induced elevation of tubular epithelial permeability, which in turn might contribute to kidney injury.


Figures

FIGURE 1.
FIGURE 1.
TNF-α induces Rho-mediated cytoskeletal remodeling in tubular epithelium. A, LLC-PK1 cells, grown on coverslips, were pretreated with 1 μm Y-27632 for 20 min as indicated followed by addition of 10 ng/ml TNF-α for 2 min. The cells were fixed and permeabilized, and F-actin was visualized using rhodamine-labeled phalloidin. The images were enhanced by deconvolution to remove out of focus fluorescence. B and D, confluent LLC-PK1 (B) or MDCK (D) cells grown on 10-cm dishes were treated with 10 ng/ml TNF-α for the indicated times (B) or 2 min (D). The amount of active RhoA was determined using a GST-RBD precipitation assay. RhoA in the precipitates (active RhoA) and total cell lysates (total RhoA) was detected by Western blotting using RhoA antibody. The blots were quantified by densitometry, and the results were expressed as the -fold increase compared with the values obtained in control cells. The graph in B shows mean ± S.E. from n = 3 independent experiments. C, LLC-PK1 cells grown on coverslips were cotransfected with vectors for C3 transferase and GFP. After 48 h, the cells were treated with TNF-α for 2 min. The cells were fixed, and F-actin was visualized as in A. F-actin staining (left panels) and GFP fluorescence (right panels) in the same field are shown. con, control.
FIGURE 2.
FIGURE 2.
TNF-α induces ROK-dependent MLC and cofilin phosphorylation in tubular epithelium. A, C, and D, confluent LLC-PK1 cells were treated with 10 ng/ml TNF-α for the indicated times. Cells were lysed, and phospho-MLC (A and C) or phosphocofilin (p-Cofilin) (D) was detected by Western blotting. Where indicated, cells were pretreated with 20 μm Y-27632 for 30 min. The inhibitor was present throughout the TNF-α treatment. The blots were redeveloped with β-actin, MLC (A and C), or cofilin (D) antibodies to demonstrate equal loading. Note that although the phospho-MLC antibody recognizes two isoform of MLC the total MLC antibody reacts with only one band. B, cells grown on coverslips were exposed to 10 ng/ml TNF-α for 2 min, fixed, and stained using the pMLC-specific antibody. The images were deconvolved as in Fig. 1A. con, control.
FIGURE 3.
FIGURE 3.
Identification of GEF-H1 as a TNF-α-activated GEF. A, control or TNF-α-treated (10 ng/ml for 2 min) MDCK cells were lysed, and active GEFs were captured using GST-RhoG17A. The precipitated proteins were separated by SDS-PAGE. A typical gel stained with Coomassie Blue is shown. The two lanes were run on the same gel. Additional lanes running between them were removed from the image. The box, enlarged on the right, marks an area of the samples where TNF-α stimulation resulted in the appearance of well defined bands. The prominent band, indicated by the arrow, yielded peptide sequences corresponding to GEF-H1. B, LLC-PK1 cells were treated with 10 ng/ml TNF-α, lysed, and subjected to precipitation with either GST-RhoG17A (left) or control glutathione-Sepharose beads (right). GEF-H1 in the precipitates (active) and the cell lysates (total) was detected by Western blotting. The blots were analyzed by densitometry, and for each experiment the changes were expressed as -fold increase from the control. The graph shows mean ± S.E. (n = 11 independent experiments).
FIGURE 4.
FIGURE 4.
GEF-H1 down-regulation prevents TNF-α-induced activation of the Rho pathway. A, LLC-PK1 cells were transfected with NR siRNA or two different siRNAs designed against porcine GEF-H1 (GEF-H1 number 1 and GEF-H1 number 2). 48 h after transfection cells were lysed, and GEF-H1 in the cell lysates was detected by Western blotting. The same blot was redeveloped with an antibody against glyceraldehyde-3-phosphate dehydrogenase (GAPDH) as a loading control. B–E, cells were transfected with NR or GEF-H1-specific siRNA 1 (B) or2(C–E). 48 h later the cells were treated with TNF-α for 2 min as indicated. Active RhoA (B and C), F-actin (D), and pMLC (E) were detected as in Fig. 1. In B, C, and E the blots with the total cell lysates were stripped and redeveloped with a GEF-H1 antibody. Glyceraldehyde-3-phosphate dehydrogenase served as loading control. The graphs in C and E show mean ± S.E. from at least three independent experiments. F, GEF-H1 down-regulation does not affect activation of NFκB. Cells grown on coverslips and transfected with NR or GEF-H1-specific siRNA 2 were left untreated or exposed to TNF-α for 30 min. The cells were fixed and stained with an antibody against NFκB p65. Note that TNF-α-induced p65 translocation to the nucleus following GEF-H1 down-regulation is unaltered, showing that Rho-independent TNF-α signaling is intact. con, control.
FIGURE 5.
FIGURE 5.
TNF-α induced phosphorylation of Thr-678 in GEF-H1. A, LLC-PK1 cells were treated with 10 μm PD98059 for 15 min as indicated followed by the addition of TNF-α for the indicated times. The cells were lysed, and phospho-ERK1/2 (pERK) was detected. B, cells were transfected with cDNA encoding for HA-tagged GEF-H1. 24 h later, the cells were left untreated or exposed to TNF-α for 2 min. Where indicated, cells were treated with 10 μm PD98059 for 15 min followed by additions of TNF-α in the presence of the drug. The cells were then lysed, and GEF-H1 was precipitated using an anti-HA antibody. The precipitates were subjected to Western blotting with anti-phosphothreonine (p-Thr). The same blot was stripped and reprobed with anti-HA to demonstrate equal precipitation of HA-GEF-H1. The graph summarizes the densitometric analysis of n = 3 independent experiments (mean ± S.E.). C, cells were transfected with cDNA encoding for GFP-tagged GEF-H1 WT, C terminus-deleted (ΔC), or T678A mutant. 48 h later, the cells were left untreated or exposed to TNF-α for 2 min. The cells were then lysed, and GEF-H1 was precipitated using an anti-GFP antibody. The precipitates were subjected to Western blotting with anti-phosphothreonine. The same blot was stripped and reprobed with anti-GFP to demonstrate equal precipitation of the proteins. The arrowhead points to the level of the WT and T678 GEF-H1, and the arrow shows the level of GEF-H1ΔC. The graph summarizes the densitometric analysis of n = 3 independent experiments analyzing threonine phosphorylation of the WT GEF-H1 (mean ± S.E.). D, cells were transfected with cDNA encoding for GFP-tagged GEF-H1 T678A mutant. The cells were treated with 10 μm PD98059 (PD) for 15 min followed by precipitation using anti-GFP and detection of phosphothreonine as in C. The graph summarizes the densitometric analysis of n = 3 independent experiments (mean ± S.E.). WB, Western blot; IP, immunoprecipitation; con, control.
FIGURE 6.
FIGURE 6.
Role of the ERK pathway in activation of the GEF-H1/Rho pathway. In A, C, and D, LLC-PK1 cells were treated with 10 μm PD98059 for 15 min as indicated followed by the addition of TNF-α for 2 min. B, cells were transfected with GFP-tagged WT or T678A GEF-H1. In both A and B, active GEF-H1 was precipitated as described earlier, and samples were analyzed by Western blot using either GEF-H1 or GFP antibody. C, Active Rho was precipitated as in Fig. 1. D, cell lysates were probed for pMLC. The graphs summarize the densitometric analysis of n = 5(A), n = 4(B), n = 7(C), or n = 3(D) independent experiments (mean ± S.E.). con, control; WB, Western blot.
FIGURE 7.
FIGURE 7.
The TNF-α-induced rise in paracellular permeability is mediated by MLC phosphorylation. LLC-PK1 cells were grown to confluence on Costar Transwell filters. The medium in both the top and bottom compartments was replaced by Hanks' buffered salt solution, and the cells were exposed to 2 mg/ml FITC-labeled dextran (4 kDa) added apically in the absence or presence of 10 ng/ml TNF-α. A, FITC fluorescence was measured in samples taken from the bottom compartment at 30-min intervals. The graph represents data of three parallel measurements of a typical experiment for control (dark symbols) or TNF-α-treated cells (open symbols). B, the fluorescence values obtained at the 3-h time point in parallel measurements as in A were averaged and normalized to the control. The graph shows the mean ± S.E. from n = 9 experiments. C, where indicated, LLC-PK1 cells grown on Transwell filters were pretreated with 1 μm PD98059 for 15 min followed by the addition of TNF-α. The inhibitor was present throughout the whole measurement. Paracellular permeability was measured as in A. The graph shows data of fluorescence values obtained at the 3-h time point of n = 5 measurements. D, AA-MLC acts as a dominant negative MLC. Control (empty vector-expressing cells) or AA-MLC-expressing LLC-PK1 cells were grown on coverslips. The cells were treated with TNF-α for 30 min, fixed, and co-stained with anti-Myc and anti-pMLC. The pictures show Myc (top row) and pMLC (bottom row) staining of the same field. E, paracellular permeability across confluent monolayers of control or AA-MLC-expressing cells was measured as in A. A typical experiment is shown. Fluorescence values obtained at the 3-h time point of three parallel measurements were averaged and expressed as mean ± S.E. F, AA-MLC cells are responsive to TNF-α. AA-MLC cells were treated for the indicated times with TNF-α and lysed, and phospho-ERK1/2 (pERK) was detected. The same blot was redeveloped with anti-β-actin to demonstrate equal loading. AU, arbitrary units; con, control.

Similar articles

Cited by

References

    1. Baud, V., and Karin, M. (2001) Trends Cell Biol. 11, 372-377 - PubMed
    1. Wajant, H., Pfizenmaier, K., and Scheurich, P. (2003) Cell Death Differ. 10, 45-65 - PubMed
    1. Vielhauer, V., and Mayadas, T. N. (2007) Semin. Nephrol. 27, 286-308 - PubMed
    1. Pascher, A., and Klupp, J. (2005) BioDrugs 19, 211-231 - PubMed
    1. Noiri, E., Kuwata, S., Nosaka, K., Tokunaga, K., Juji, T., Shibata, Y., and Kurokawa, K. (1994) Am. J. Pathol. 144, 1159-1166 - PMC - PubMed

Publication types