. 2009 Mar 4;29(9):2890-901.
doi: 10.1523/JNEUROSCI.5093-08.2009.

Synaptically released zinc triggers metabotropic signaling via a zinc-sensing receptor in the hippocampus

Affiliations

Synaptically released zinc triggers metabotropic signaling via a zinc-sensing receptor in the hippocampus

Limor Besser et al. J Neurosci. .

Abstract

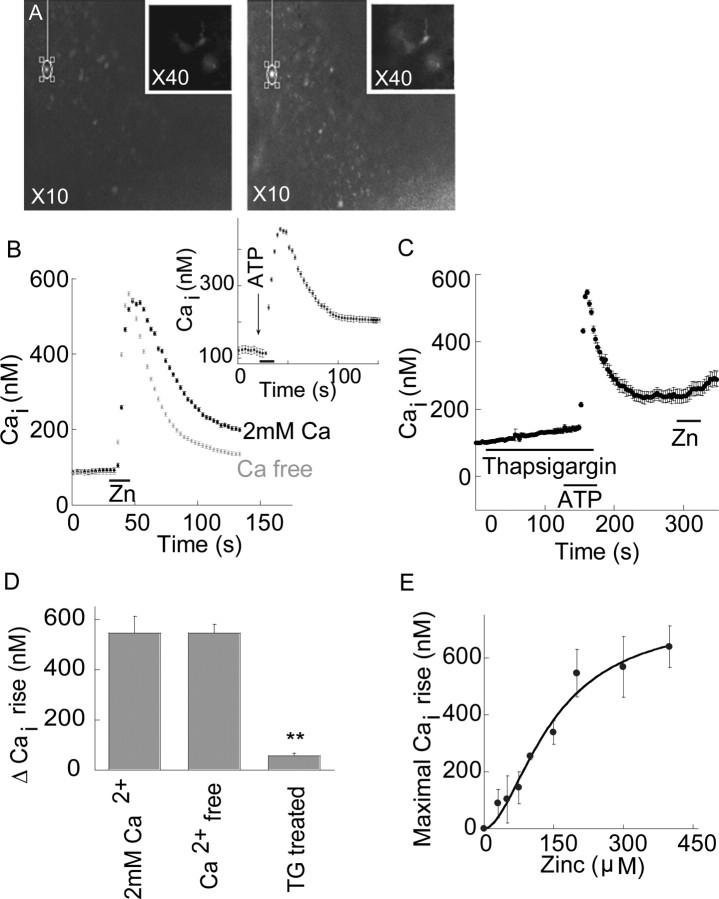
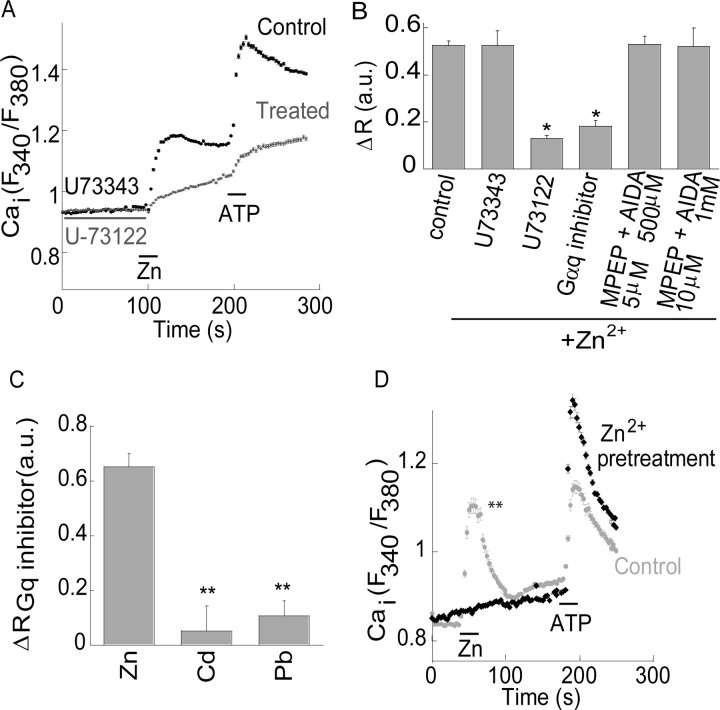
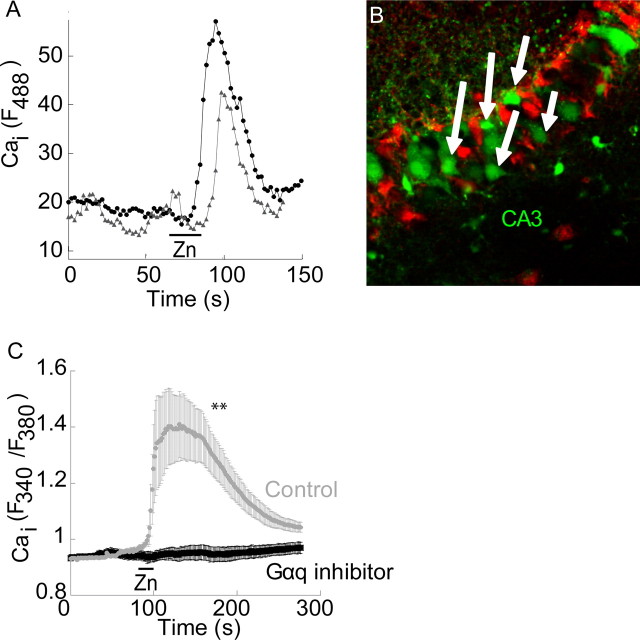
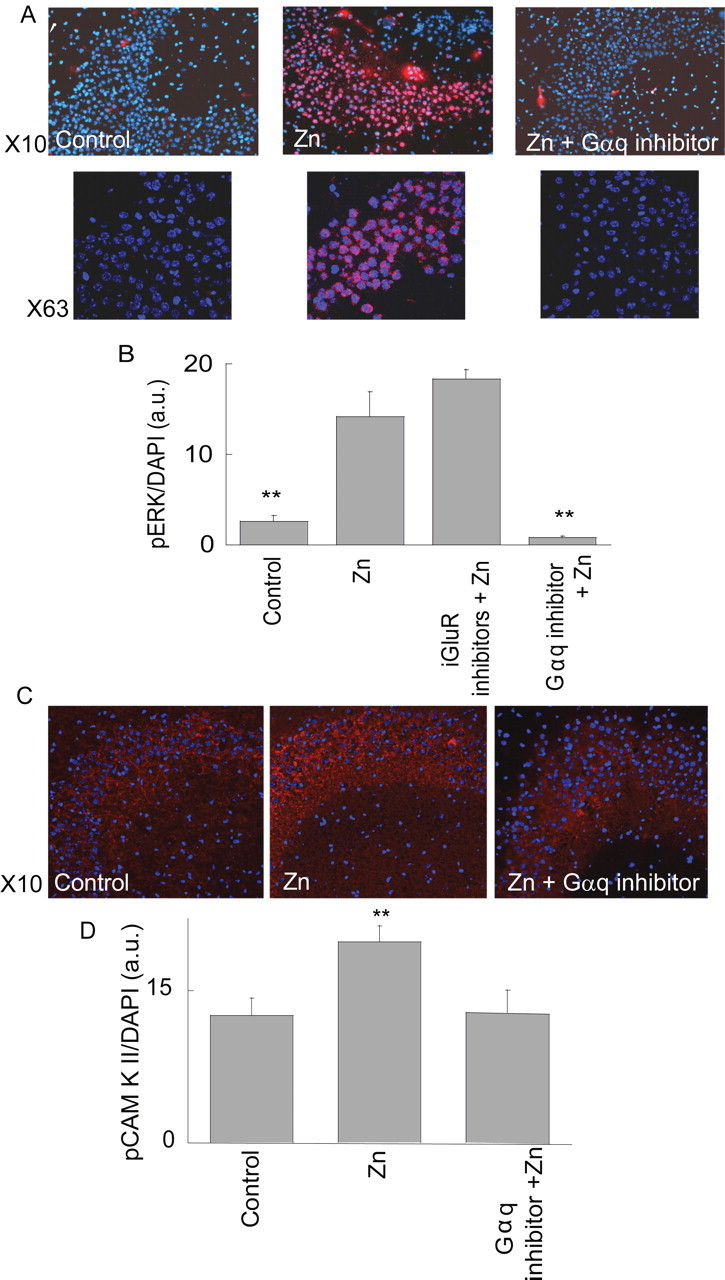
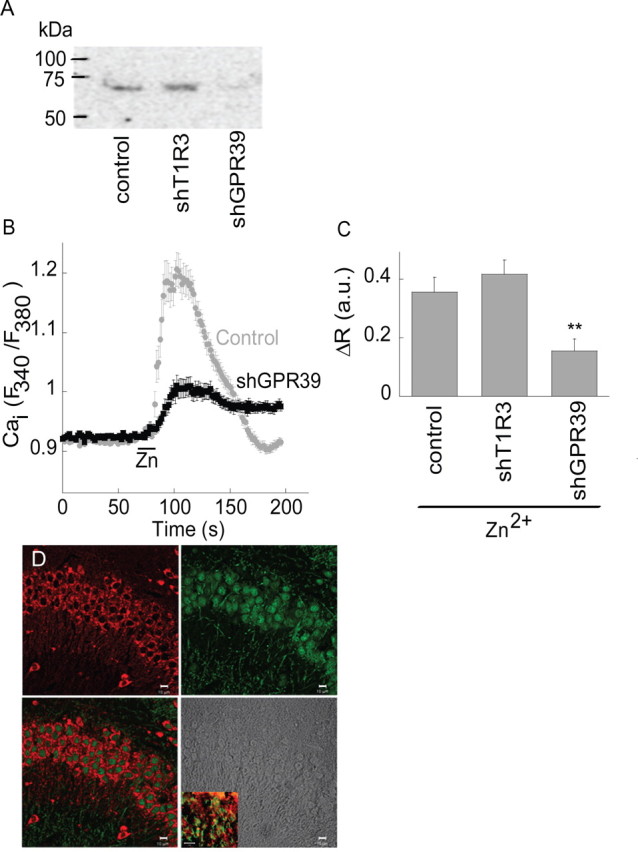
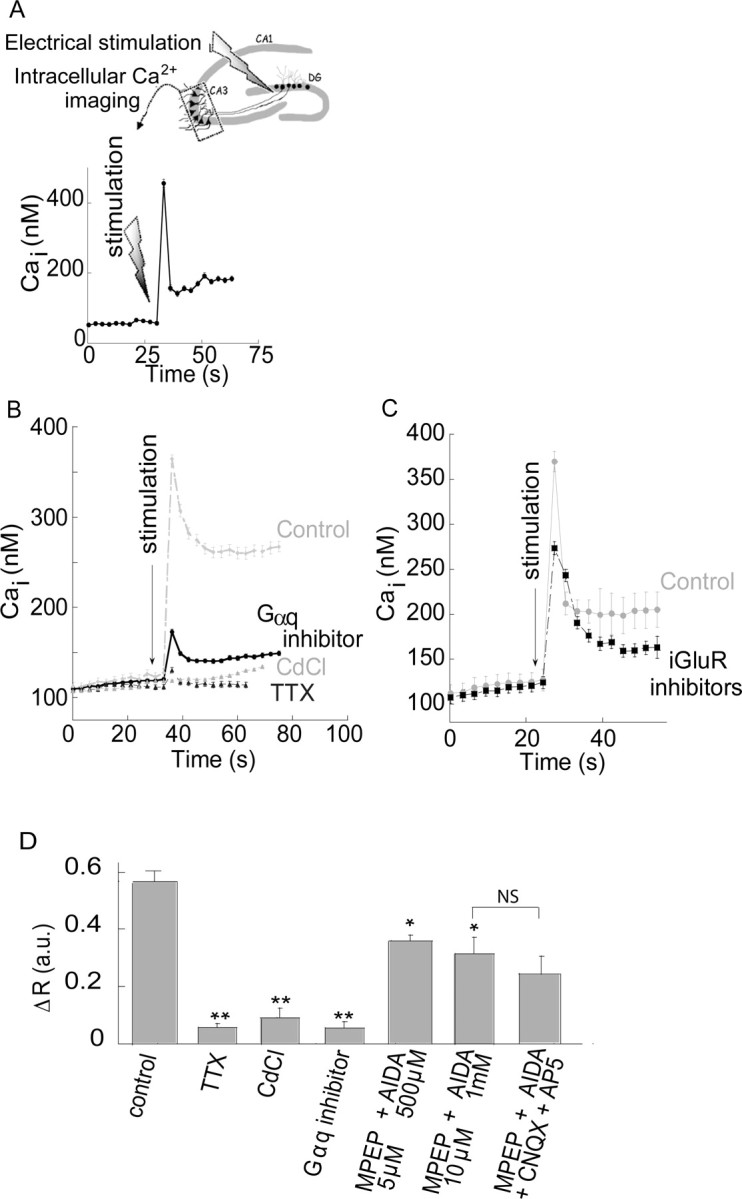
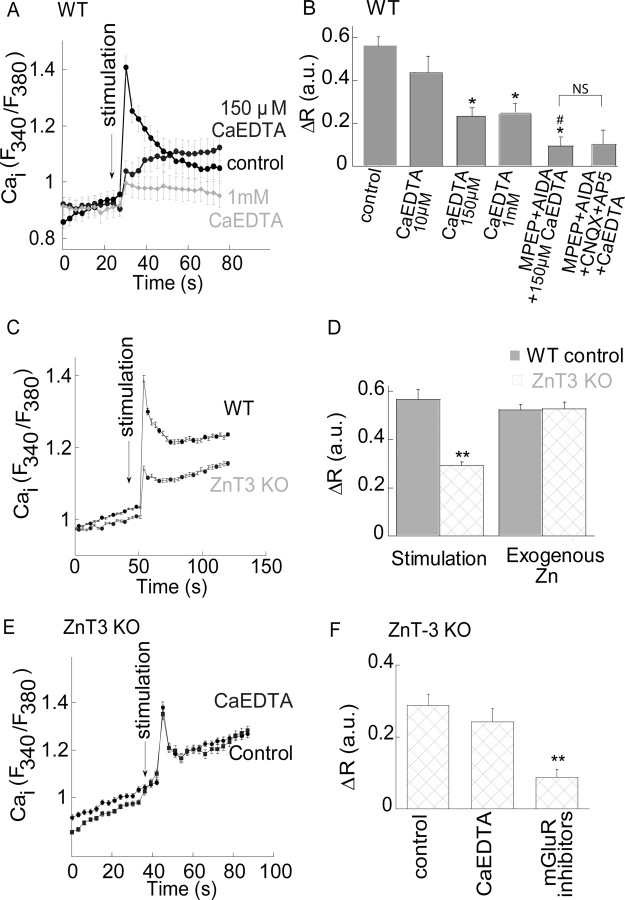
Zn(2+) is coreleased with glutamate from mossy fiber terminals and can influence synaptic function. Here, we demonstrate that synaptically released Zn(2+) activates a selective postsynaptic Zn(2+)-sensing receptor (ZnR) in the CA3 region of the hippocampus. ZnR activation induced intracellular release of Ca(2+), as well as phosphorylation of extracellular-regulated kinase and Ca(2+)/calmodulin kinase II. Blockade of synaptic transmission by tetrodotoxin or CdCl inhibited the ZnR-mediated Ca(2+) rises. The responses mediated by ZnR were largely attenuated by the extracellular Zn(2+) chelator, CaEDTA, and in slices from mice lacking vesicular Zn(2+), suggesting that synaptically released Zn(2+) triggers the metabotropic activity. Knockdown of the expression of the orphan G-protein-coupled receptor 39 (GPR39) attenuated ZnR activity in a neuronal cell line. Importantly, we observed widespread GPR39 labeling in CA3 neurons, suggesting a role for this receptor in mediating ZnR signaling in the hippocampus. Our results describe a unique role for synaptic Zn(2+) acting as the physiological ligand of a metabotropic receptor and provide a novel pathway by which synaptic Zn(2+) can regulate neuronal function.


Figures

Figure 1.
Figure 1.
A metabotropic Zn2+-dependent Ca2+ response is observed in the hippocampus. A, Fluorescence image before (left), and after (right) application of 200 μm zinc (×10). Inset shows high magnification images (×40). B, Intracellular Ca2+ signal in the pyramidal cell layer, CA3, after application of extracellular Zn2+ (200 μm) in the presence or absence of 2 mm Ca2+ in the ACSF perfusate. The response after application of ATP (300 μm) is shown in the inset. C, ER Ca2+ stores were depleted using TG (1 μm), an ER Ca2+ pump inhibitor, and the purinergic agonist, ATP (300 μm). Subsequently, Zn2+ (200 μm) was applied and Fura-2 fluorescence was monitored. D, A summary of the averaged Zn2+-dependent Ca2+ response in the presence or absence of extracellular or intracellular Ca2+, is presented (**p < 0.01, n = 10 for each treatment). E, Zn2+ was applied at the indicated concentrations, and the calibrated intracellular Ca2+ level as a function of increasing Zn2+ concentration is shown (n = 4 for each concentration). The data were fitted to a Michaelis–Menten equation and yielded an apparent Km of 146 ± 26 μm for Zn2+ and a Hill coefficient of 1 ± 0.8.
Figure 2.
Figure 2.
The Ca2+ rise triggered by Zn2+ is mediated by a Gq- and PLC-dependent pathway. A, Slices were pretreated (as marked) with the PLC inhibitor U73122 (1 μm, active form) or its inactive derivative U73343 (1 μm, control) and Zn2+ (200 μm) was applied. As control, ATP (300 μm) was subsequently applied. The Ca2+ signal (Fura-2) is shown. B, The averaged Ca2+ rise triggered by Zn2+ in the presence of the inhibitors of PLC (U73122, 1 μm) or Gαq (YM-254890, 1 μm) or the mGluR1 and 5 inhibitors (AIDA and MPEP, respectively) at the indicated concentrations (**p < 0.01, n = 20 for control and n = 9 for all other treatments). C, The fluorescent response observed after application of Cd2+ and Pb2+ were monitored in the absence or presence of the Gαq inhibitor (1 μm, YM-254890). The difference (ΔRGq inhibitor) between the response in the presence or absence of the inhibitor is shown (**p < 0.01, n = 5). D, Slices were pretreated with 75 μm Zn2+ or ACSF for 15 min, washed, and allowed to recover in ACSF for 60–100 min. Zn2+ (300 μm) was then reapplied while monitoring the Ca2+ response. As control, ATP (300 μm) was subsequently applied (**p < 0.01, n = 7).
Figure 3.
Figure 3.
Zn2+-dependent Ca2+ rise is monitored in CA3 neurons but not in astrocytes. A, Confocal microscope analysis of slices that were loaded with the Ca2+ indicator, Fluo-4 (5 μm). The Ca2+ rise after application of Zn2+ in two representative cells is shown. B, Cells that showed Zn2+-dependent Ca2+ rise were indicated (arrows) and subsequently SR101 (1 μm) was added to mark astroglia cells (red). C, Zn2+ (200 μm) was applied to SH-SY5Y neuronal cells loaded with Fura-2 in the absence or presence of the Gαq inhibitor (1 μm YM-254890) (**p < 0.01, n = 9).
Figure 4.
Figure 4.
The metabotropic Zn2+-dependent response is followed by phosphorylation of ERK1/2 and CaMKII in the CA3 region. A, Zn2+ (100 μm, 90 s) was applied to slices in the presence or absence of the Gαq inhibitor (1 μm, YM-254890). Slices were then reacted with pERK1/2 antibody, shown in red, and DAPI (blue). Images acquired at ×10 (top) and ×63 (confocal, bottom) are shown. B, Quantitative analysis of ERK1/2 phosphorylation normalized to DAPI staining in the CA3 region. Shown is the phosphorylation after application of Zn2+ in the absence or presence of the ionotropic glutamate inhibitors (CNQX, 20 μm and AP5, 50 μm) and Ca2+ channel blocker (nimodipine 1 μm), or the Gαq inhibitor (1 μm YM-254890) (**p < 0.01, n = 6). C, Slices treated with Zn2+ (100 μm, 3 min), in the presence or absence of the Gαq inhibitor, were then reacted with pCaMKII antibodies (red) and DAPI (blue). D, Quantitative analysis of pCaMKII staining normalized to DAPI staining (**p < 0.01, n = 6).
Figure 5.
Figure 5.
ZnR signaling is mediated by GPR39. A, Western blot analysis of GPR39 expression in SH-SY5Y cells transfected with control vector, shGPR39 or shT1R3 plasmids. B, The Ca2+ response after application of Zn2+ (100 μm) in cells transfected with the shGPR39 or vector (control). C, Quantitative analysis of the Zn2+-dependent Ca2+ rise in cells transfected with the shGPR39, shT1R3 or control (**p < 0.01, n = 9). D, Confocal images of GPR39 labeling (red) and the neuronal marker NeuN (green) in the CA3. A combined image of both indicates that GPR39 is expressed in neuronal cells (bottom left). Bright field image is also shown (bottom right). Insert shows staining of the dendritic marker MAP2 (green) combined with GPR39 labeling (red) in the CA3 neurons (scale bar, 10 μm).
Figure 6.
Figure 6.
Mossy fiber stimulation triggers a metabotropic Ca2+ rise that is partially independent of the mGluRs. A, Schematic representation of the experimental setup for electrical stimulation. A stimulating electrode was placed at the mossy fiber axons, near the dentate gyrus (DG) and the Fura-2 signal was monitored in the CA3 pyramidal cell layer. Shown is a representative time lapse Ca2+ signal acquired from a single cell, after electrical stimulation (66 Hz, 100 μA for 150 ms, total of 10 pulses) of the mossy fibers at the marked time. B, The Ca2+ response in the CA3 region after electrical stimulation of the mossy fibers in the presence or absence of the Gαq inhibitor (1 μm, YM-254890), with the voltage-gated Na+-channel blocker TTX (1 μm), or with the voltage-gated Ca2+ channel blocker CdCl (200 μm). Representative responses averaged over 25 cells in 1 slice. C, Slices were treated with the iGluR inhibitors (CNQX, 20 μm and AP5, 50 μm) subsequently the mossy fibers were stimulated and the Ca2+ response is shown. Representative responses averaged over 24 cells in 1 slice. D, The averaged responses of the Ca2+ rise triggered after electrical stimulation of the mossy fibers in control slices (n = 23) or in slices treated with TTX (n = 6), CdCl (n = 6), the Gαq inhibitor (n = 6), the mGluR1 and 5 inhibitors (AIDA and MPEP, respectively, n = 6) or the mGluRs inhibitors together with the iGluRs inhibitors (1 mm AIDA, 10 μm MPEP, 20 μm CNQX and 50 μm AP5, n = 4) (*p < 0.05, **p < 0.01; NS, nonsignificant).
Figure 7.
Figure 7.
The metabotropic Ca2+ response is attenuated in the absence of synaptic Zn2+. A, The Ca2+ response in cells in the CA3 region after electrical stimulation of the mossy fibers in the presence or absence of the extracellular Zn2+ chelator CaEDTA at the indicated concentrations. Representative responses averaged over 28 cells in 1 slice. B, The averaged Ca2+ response in the presence or absence of CaEDTA (n = 9) at the indicated concentration, or 150 μm CaEDTA in the presence of the mGluR inhibitors (n = 6), or CaEDTA with the mGluR and iGluR inhibitors (n = 4) (*p < 0.05 compared with control and #p < 0.05 compared with CaEDTA alone; NS, nonsignificant). The control is the same as in Figure 6D. C, The response of cells in the CA3 region after electrical stimulation of the mossy fibers in slices obtained from ZnT3 KO versus WT, control, mice. Representative responses averaged over 23 cells in 1 slice. D, Summary of the Ca2+ responses triggered in slices from the ZnT3 KO and WT mice after electrical stimulation or the application of exogenous Zn2+ using the paradigm described in Figure 1 (**p < 0.01, n = 11 for each treatment, the WT control is the same as in Fig. 6D for the stimulation induced response and to Fig. 2B for the exogenous Zn2+ application). E, The Ca2+ rise triggered in slices from the ZnT3 KO mice in the presence or absence of CaEDTA. Representative response averaged over 26 cells in 1 slice. F, Averaged response after electrical stimulation of the mossy fibers in slices from ZnT3 KO mice in the presence of CaEDTA (n = 7) or the mGluR inhibitors (500 μm AIDA, 5 μm MPEP, n = 7) (**p < 0.01).

References

    1. Aizenman E, Stout AK, Hartnett KA, Dineley KE, McLaughlin B, Reynolds IJ. Induction of neuronal apoptosis by thiol oxidation: putative role of intracellular zinc release. J Neurochem. 2000;75:1878–1888. - PubMed
    1. An WL, Pei JJ, Nishimura T, Winblad B, Cowburn RF. Zinc-induced anti-apoptotic effects in SH-SY5Y neuroblastoma cells via the extracellular signal-regulated kinase 1/2. Brain Res Mol Brain Res. 2005;135:40–47. - PubMed
    1. Azriel-Tamir H, Sharir H, Schwartz B, Hershfinkel M. Extracellular zinc triggers ERK-dependent activation of Na+/H+ exchange in colonocytes mediated by the zinc-sensing receptor. J Biol Chem. 2004;279:51804–51816. - PubMed
    1. Beierlein M, Fall CP, Rinzel J, Yuste R. Thalamocortical bursts trigger recurrent activity in neocortical networks: layer 4 as a frequency-dependent gate. J Neurosci. 2002;22:9885–9894. - PMC - PubMed
    1. Berkeley JL, Levey AI. Cell-specific extracellular signal-regulated kinase activation by multiple G protein-coupled receptor families in hippocampus. Mol Pharmacol. 2003;63:128–135. - PubMed

Publication types

MeSH terms

LinkOut - more resources