. 2009 Sep;48(9):843-52.
doi: 10.1002/mc.20529.

Effect of ultraviolet B radiation on activator protein 1 constituent proteins and modulation by dietary energy restriction in SKH-1 mouse skin

Affiliations

Effect of ultraviolet B radiation on activator protein 1 constituent proteins and modulation by dietary energy restriction in SKH-1 mouse skin

Brian D Hopper et al. Mol Carcinog. 2009 Sep.

Abstract

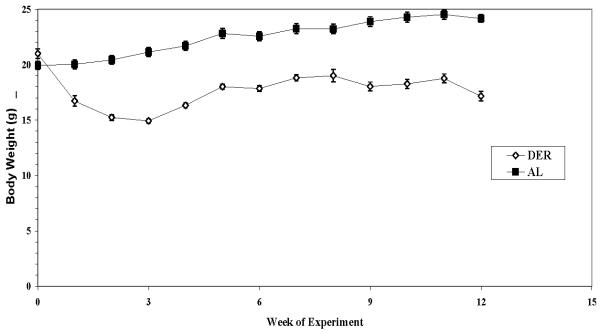
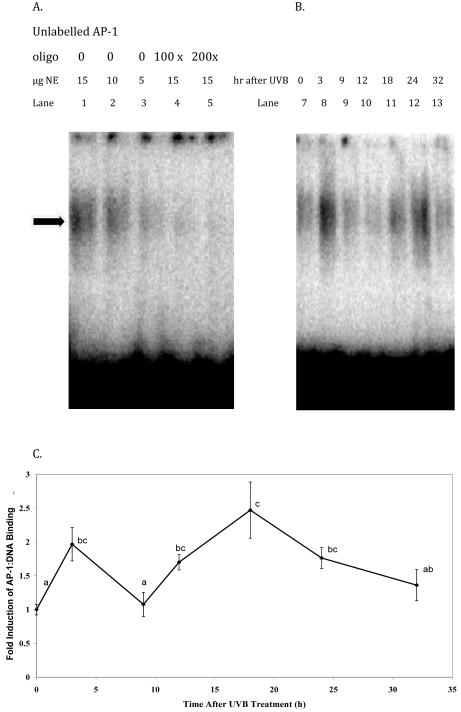
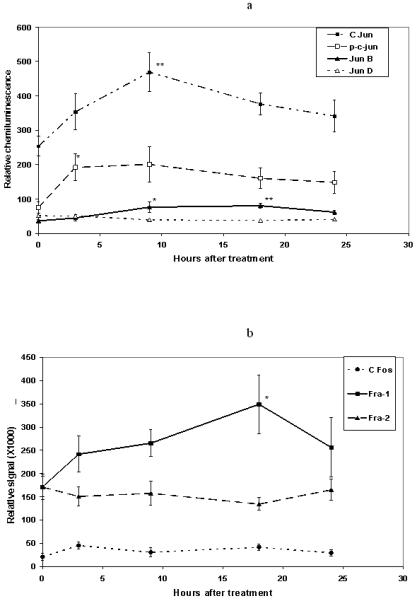
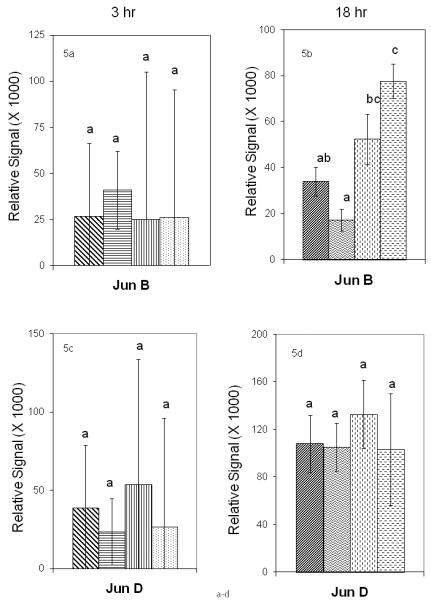
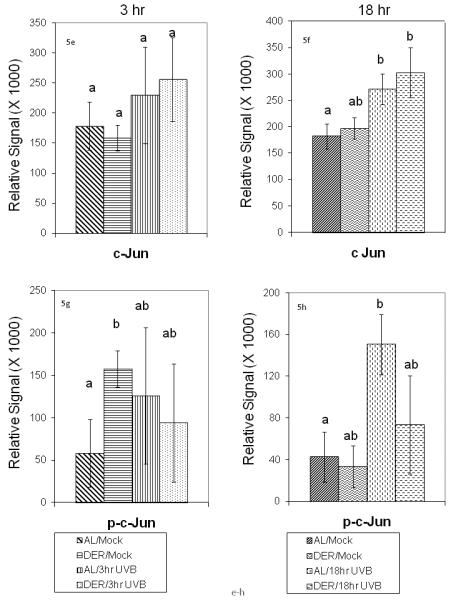
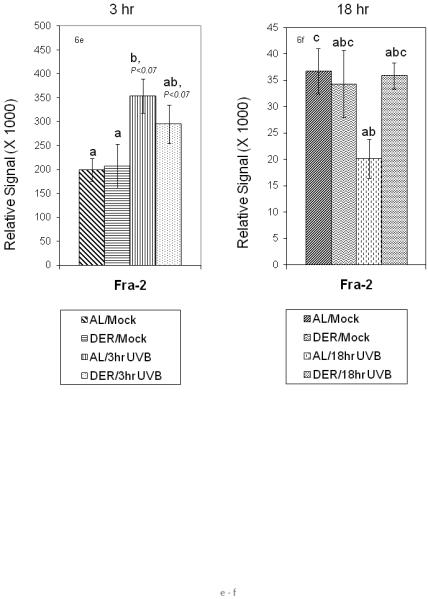
The study examined the timing of modulation of activator protein 1(AP-1):DNA binding and production of AP-1 constituent proteins by ultraviolet B (UVB) radiation and effect of dietary energy restriction [DER, 40% calorie reduction from fat and carbohydrate compared to control ad libitum (AL) diet] in SKH-1 mouse epidermis. AP-1:DNA binding by electromobility shift assay (EMSA) was increased in a biphasic manner after treatment with a tumor-promoting suberythemal dose (750 mJ/cm(2)) of UVB light (311-313 nm) with peaks at 3 and 18 h postirradiation. DER overall reduced AP-1:DNA binding in mock-treated and UVB-treated skin at 3 and 18 h after UVB treatment. The timing of modulation of production of AP-1 constituent proteins by Western blot analysis was examined at 0 h (mock treatment), 3, 9, 18, and 24 h. We found that c-jun (9 h), jun-B (9 and 18 h), phosphorylated c-jun (3 h), and fra-1 (18 h) protein levels were increased after UVB treatment compared to mock controls. In a follow-up diet experiment, animals were placed on DER or AL diet for 10-12 wk and treated with UVB as before. DER was found to completely block the UVB-induced increase in phosphorylated c-jun protein levels and decrease in fra-2 protein levels at 18 h. In addition, DER enhanced UVB-induced increase in jun B levels and lowered basal levels of c-fos seen 18 h after UVB. These data suggest that DER may be able to assist in the prevention of UVB-induced skin carcinogenesis by modulating AP-1:DNA binding and AP-1 constituent protein levels.


Figures

Figure 1
Figure 1. Body weights of ad libitum and dietary energy restricted mice
Values represent the mean ± SEM of 22 AL-fed animals and 16 DER animals and values without visible error bars had error bars smaller than the symbols. Week 0 corresponds to 8 weeks of age. Animals in the DER group were placed on dietary energy restriction at week 0. Analysis of body weight by single factor ANOVA revealed a statistically significant difference between AL and DER fed animals (P<0.0001). T-test showed the mean body weights were different at week 1 of the experiment and remained that way until the end of the experiment (P<0.0001). AL (■) and DER (◘).
Figure 2
Figure 2. Changes in AP-1:DNA binding over a 32 hour period following UVB treatment
A, Electrophoretic mobility shift assay (EMSA) image of AP-1 competition experiment showing that the AP-1 shifted band (arrow) is AP-1 specific because it is competed out by excesses of unlabeled AP-1 consensus oligonucleotide (lane 1 compared to lanes 4 or 5) and that decreasing amounts of nuclear extract (NE) from mouse skin treated with UVB decreases the AP-1 shifted band (lanes 1-3). B, Example image of an EMSA gel showing AP-1:DNA binding in nuclear extracts from SKH-1 mouse dorsal skins treated with 750mJ/cm2 UVB or mock treated and harvested after the indicated times (lanes 7-13). Each lane contains about 100,000 cpm of labeled AP-1 oligo, 0.5 ug poly(dI-dC) and 15ug mouse epidermal NE from one mouse per lane. B. Values, ± SEM for 8-16 observations per group, represent the fold induction of AP-1:DNA binding obtained by dividing each individual measurement of radioactivity of the AP-1 shifted band at each time from one mouse by the mean measurement at time 0 for two experiments.. Each measurement of radioactivity (in arbitrary units) was normalized for gel to gel variation using a factor derived from a control mouse sample loaded onto each of 3-4 gels. Time points that do not share common letters are significantly different (P < 0.05) by SAS software using the GLM method.
Figure 3a and 3b
Figure 3a and 3b. Effect of UVB treatment and DER on AP-1:DNA binding 3 (A) and 18 (B) hours after treatment with UVB
Values represent the mean measurement of radioactivity ± SE of 8-11 mice/group normalized as noted in Fig 2. Analysis by two-way ANOVA of the mean of the natural logarithms of radioactivity for the experimental groups showed a significant difference due to diet for the 3 h UVB groups (P < 0.03) and 18 h UVB groups (P < 0.002). Posthoc Tukey-Kramer t-test analysis of the least squares from the two-way ANOVA showed a difference between AL/UVB and DER/UVB groups in the 18h UVB experiment (a>b, P < 0.05).
Figure 4A and 4B
Figure 4A and 4B. Timing of modulation of AP-1 constituent proteins by UVB
Each data point represents data from 8-11 animals. Symbols show the mean ± SEM and values without visible error bars had error bars smaller than the symbols. Asterisks signify significant difference from mock (0 hr) treatment as analyzed by single factor ANOVA followed by Dunnett’s test for each individual protein. In the case of unequal variances, the Kruskal-Wallis test was used in place of the single factor ANOVA and Dunn’s multiple comparison test was used in place of Dunnett’s test. *=P<0.05, **=P<0.001.
Figure 5a - 5h
Figure 5a - 5h
Effect of dietary energy restriction on UVB induced modulation of AP-1 jun constituent proteins at 3 and 18 hours after UVB treatment. Values represent the mean ± SE, N=8-11 mice for each data point). Differences between treatment groups for each protein were measured by two-way ANOVA. If two-way ANOVA showed a significant difference, individual means were analyzed by t-test. Results of t-tests are indicated by a
Figure 5a - 5h
Figure 5a - 5h
Effect of dietary energy restriction on UVB induced modulation of AP-1 jun constituent proteins at 3 and 18 hours after UVB treatment. Values represent the mean ± SE, N=8-11 mice for each data point). Differences between treatment groups for each protein were measured by two-way ANOVA. If two-way ANOVA showed a significant difference, individual means were analyzed by t-test. Results of t-tests are indicated by a
Figure 6a - 6f
Figure 6a - 6f
Effect of dietary energy restriction on UVB induced modulation of AP-1 fos constituent proteins at 3 and 18 hours after UVB treatment. Values represent the mean ± SE, N=8-11 mice for each data point). Differences between treatment groups for each protein were measured by two-way ANOVA. If two-way ANOVA showed a significant difference, individual means were analyzed by t-test. Results of t-tests are indicated by a
Figure 6a - 6f
Figure 6a - 6f
Effect of dietary energy restriction on UVB induced modulation of AP-1 fos constituent proteins at 3 and 18 hours after UVB treatment. Values represent the mean ± SE, N=8-11 mice for each data point). Differences between treatment groups for each protein were measured by two-way ANOVA. If two-way ANOVA showed a significant difference, individual means were analyzed by t-test. Results of t-tests are indicated by a
Figure 7
Figure 7
Representative western blot showing the effect of dietary energy restriction on UVB induced modulation of c-fos protein at 18 hours after UVB treatment. Lanes contained 100 mg protein and in lane 1: TPA treated mouse skin from prior experiment as a control; lanes 2-10 epidermal proteins from treatment groups: lane 2: DER/UVB; lanes 3-5: AL/Mock; lanes 6-7: AL/UVB; lanes 8-10: DER/Mock; lane 11: c-fos positive control. Methods were described in the Materials and Methods section.

Similar articles

Cited by

References

    1. de VE, van de Poll-Franse LV, Louwman WJ, de Gruijl FR, Coebergh JW. Predictions of skin cancer incidence in the Netherlands up to 2015. Br.J.Dermatol. 2005;152:481–488. - PubMed
    1. Athas WF, Hunt WC, Key CR. Changes in nonmelanoma skin cancer incidence between 1977-1978 and 1998-1999 in Northcentral New Mexico. Cancer Epidemiol.Biomarkers Prev. 2003;12:1105–1108. - PubMed
    1. Bernstein LR, Colburn NH. AP1/jun function is differentially induced in promotion-sensitive and resistant JB6 cells. Science. 1989;244:566–569. - PubMed
    1. Przybyszewski J, Yaktine AL, Duysen E, Blackwood D, Wang W, Au A, Birt DF. Inhibition of phorbol ester-induced AP-1-DNA binding, c-Jun protein and c-jun mRNA by dietary energy restriction is reversed by adrenalectomy in SENCAR mouse epidermis. Carcinogenesis. 2001;22:1421–1427. - PubMed
    1. Domann FE, Jr., Levy JP, Finch JS, Bowden GT. Constitutive AP-1 DNA binding and transactivating ability of malignant but not benign mouse epidermal cells. Mol.Carcinog. 1994;9:61–66. - PubMed

Publication types

Substances