. 2009 Apr;166(1):95-102.
doi: 10.1016/j.jsb.2009.01.002.

Appion: an integrated, database-driven pipeline to facilitate EM image processing

Affiliations

Appion: an integrated, database-driven pipeline to facilitate EM image processing

Gabriel C Lander et al. J Struct Biol. 2009 Apr.

Abstract

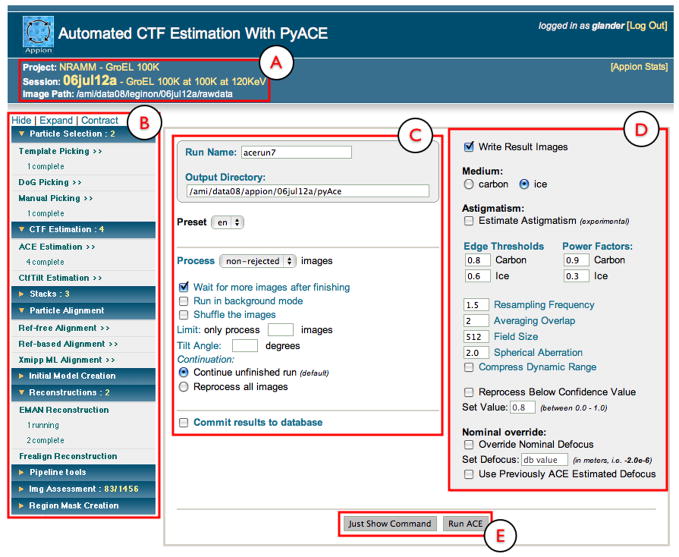
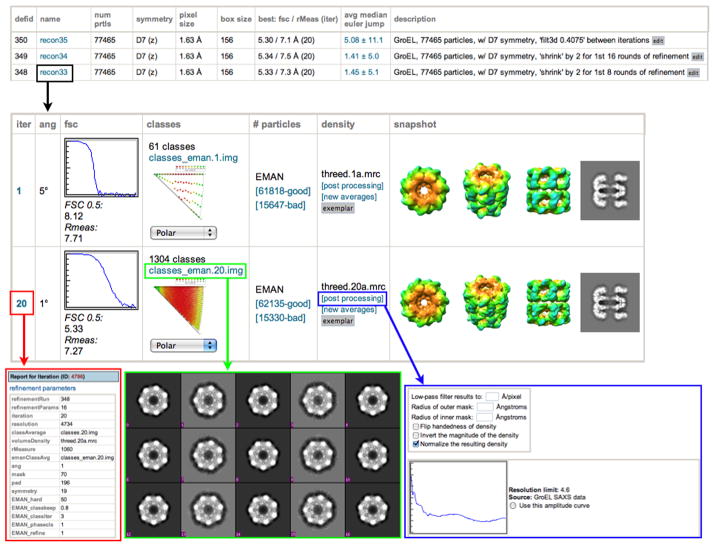
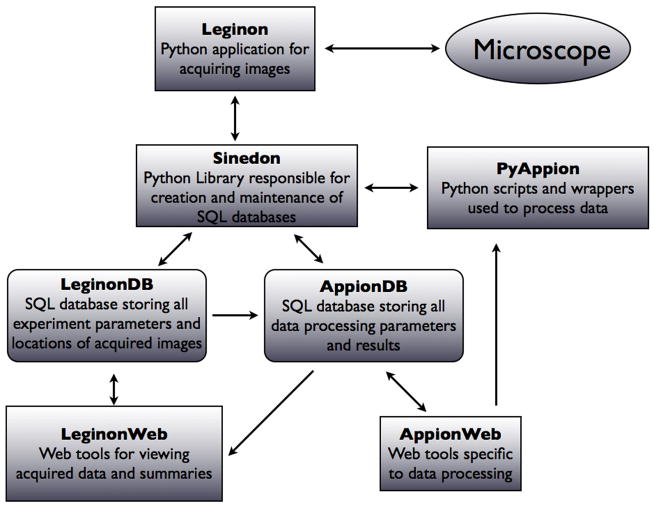
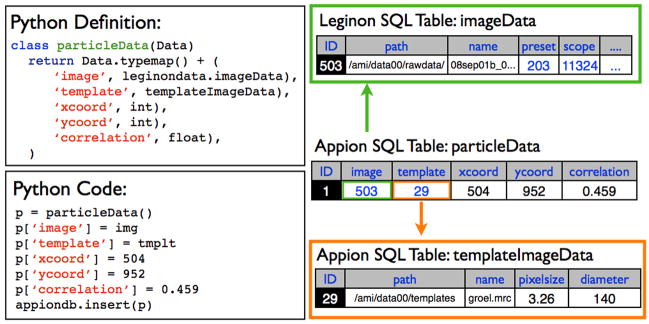
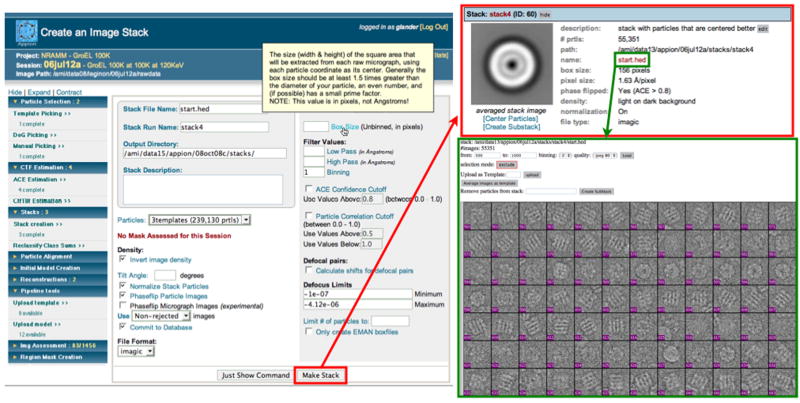
The use of cryoEM and three-dimensional image reconstruction is becoming increasingly common. Our vision for this technique is to provide a straightforward manner in which users can proceed from raw data to a reliable 3D reconstruction through a pipeline that both facilitates management of the processing steps and makes the results at each step more transparent. Tightly integrated with a relational SQL database, Appion is a modular and transparent pipeline that extends existing software applications and procedures. The user manages and controls the software modules via web-based forms, and all results are similarly available using web-based viewers directly linked to the underlying database, enabling even naive users to quickly deduce the quality of their results. The Appion API was designed with the principle that applications should be compatible with a broad range of specimens and that libraries and routines are modular and extensible. Presented here is a description of the design and architecture of the working Appion pipeline prototype and some results of its use.


Figures

Figure 1
Figure 1. Appion web-based interface
In the upper left hand section, the project, experiment name, description and raw data path is displayed (A). On the left side of all Appion Web pages, there is a navigable menu that displays all available reconstructions steps, along with the number of processing jobs that are running or completed (B). Each section of this menu can be expanded or contracted to show or hide the subsections. To the right of the menu, a web form pertaining to the currently selected reconstruction step is shown. The left portion of the form (C) is termed the appion Loop form, and is the same for all pages that will perform a function on all the images in the database. The right portion of the form shows the parameters that are specific to the current reconstruction step (D). Default values are provided for the parameters. The user has the option of either directly launching the job to a processing cluster or of requesting the text version of the command so that it can be manually launched from a Unix terminal (E).
Figure 2
Figure 2. Reconstruction report page
Overall statistics for every reconstruction stored in the database are displayed on the reconstruction summary page. Selecting one of these reconstructions links the user to a page displaying the results of each iteration (black box). For every iteration, the parameters for that iteration are available by clicking on the iteration number (red box). Plots showing the Euler angle distribution and the FSC curve. These plots, as well as most other images and graphs displayed, are thumbnails that can be displayed at full resolution by clicking on them. Class averages can be viewed by clicking on the “classes” link (green box) and particles that were used in the reconstruction vs. those that were rejected can be viewed by clicking on the “good” and “bad” links. The user has the option to do some post-processing on the 3D maps (blue box), e.g. applying a low-pass filter, masks, flipping the handedness, normalizing, and performing an amplitude adjustment.
Figure 3
Figure 3. Schematic representation of the Appion infrastructure
The Leginon application controls the microscope and acquires data interacting with the Leginon database via the Sinedon library. A set of web based tools (Leginon Web), provide a view of the data stored in the Leginon database. Processing of the acquired data is controlled form the Appion Web pages, which launch pyAppion scripts on a cluster, and store the results into the Appion database via Sinedon.
Figure 4
Figure 4. The Sinedon library
A python class is defined in appion Data.py, and instantiated in a python script. Parameters are assigned to the instance of the class, and entered into the database, using relational links, and creating new tables if necessary.
Figure 5
Figure 5. Creation of image stacks
Users are able to create an image stack from the results of a particle selection routine, filtering the particles by the confidence of the CTF estimation, the particle correlation (if an automatic particle picker was used), or by defocus limits. Popup documentation is displayed describing the “box size” parameter. The resulting stack is summarized online, with an averaged image of all the particles comprising the stack. From this point the user may examine the individual particles within the stack, center the particles using EMAN’scenalignint, or create a subset of the stack.

References

    1. Bottcher B, Wynne SA, Crowther RA. Determination of the fold of the core protein of hepatitis B virus by electron cryomicroscopy. Nature. 1997;386:88–91. - PubMed
    1. Cheng A, Fellmann D, Pulokas J, Potter CS, Carragher B. Does contamination buildup limit throughput for automated cryoEM? J Struct Biol. 2006;154:303–11. - PubMed
    1. Conway JF, Cheng N, Zlotnick A, Wingfield PT, Stahl SJ, Steven AC. Visualization of a 4-helix bundle in the hepatitis B virus capsid by cryo-electron microscopy. Nature. 1997;386:91–4. - PubMed
    1. Fellmann D, Pulokas J, Milligan RA, Carragher B, Potter CS. A relational database for cryoEM: experience at one year and 50 000 images. J Struct Biol. 2002;137:273–82. - PubMed
    1. Frank J, Radermacher M, Penczek P, Zhu J, Li Y, Ladjadj M, Leith A. SPIDER and WEB processing and visualization of images in 3D electron microscopy and related fields. J Struct Biol. 1996;116:190–9. - PubMed

Publication types

MeSH terms

LinkOut - more resources