Post-exposure vaccination against Mycobacterium tuberculosis
- PMID: 19264552
- PMCID: PMC3134938
- DOI: 10.1016/j.tube.2009.01.002
Post-exposure vaccination against Mycobacterium tuberculosis
Abstract
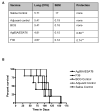
Enhancing immunity to tuberculosis in animal models after exposure to the infection has proved difficult. In this study we used a newly described flow cytometric technique to monitor changes in cell populations accumulating in the lungs of guinea pigs challenged by low-dose aerosol infection with Mycobacterium tuberculosis and vaccinated 10 days later. On day 40 after infection the fusion protein F36 and a pool of Ag85A and ESAT6 vaccines had significant effects on the bacterial load, showed increased expression of the activation marker CD45+ on CD4+ T cells, and reduced numbers of heterophils. Lung pathology and pathology scores were marginally improved in animals given these vaccines, but lymph node pathology was not influenced. Despite early effects no changes in long-term survival were seen. These results suggest that a single post-exposure vaccination can initially slow the disease process. However, this effect is transient, but this could be of use in an multidrug resistant/extremely drug resistant outbreak situation because it could potentially slow the infection long enough to complete drug susceptibility testing and initiate effective chemotherapy.
Conflict of interest statement
Competing interests. None
Figures


Similar articles
-
Influence of Mycobacterium bovis BCG vaccination on cellular immune response of guinea pigs challenged with Mycobacterium tuberculosis.Clin Vaccine Immunol. 2008 Aug;15(8):1248-58. doi: 10.1128/CVI.00019-08. Epub 2008 May 28. Clin Vaccine Immunol. 2008. PMID: 18508930 Free PMC article.
-
Aerosol vaccination with AERAS-402 elicits robust cellular immune responses in the lungs of rhesus macaques but fails to protect against high-dose Mycobacterium tuberculosis challenge.J Immunol. 2014 Aug 15;193(4):1799-811. doi: 10.4049/jimmunol.1400676. Epub 2014 Jul 14. J Immunol. 2014. PMID: 25024382 Free PMC article.
-
In Vivo Antigen Expression Regulates CD4 T Cell Differentiation and Vaccine Efficacy against Mycobacterium tuberculosis Infection.mBio. 2021 Apr 20;12(2):e00226-21. doi: 10.1128/mBio.00226-21. mBio. 2021. PMID: 33879592 Free PMC article.
-
Immunization strategies against pulmonary tuberculosis: considerations of T cell geography.Adv Exp Med Biol. 2013;783:267-78. doi: 10.1007/978-1-4614-6111-1_14. Adv Exp Med Biol. 2013. PMID: 23468114 Review.
-
Understanding and overcoming the barriers to T cell-mediated immunity against tuberculosis.Semin Immunol. 2014 Dec;26(6):578-87. doi: 10.1016/j.smim.2014.10.003. Epub 2014 Oct 28. Semin Immunol. 2014. PMID: 25453230 Free PMC article. Review.
Cited by
-
Immunization with Mycobacterium tuberculosis-Specific Antigens Bypasses T Cell Differentiation from Prior Bacillus Calmette-Guérin Vaccination and Improves Protection in Mice.J Immunol. 2020 Oct 15;205(8):2146-2155. doi: 10.4049/jimmunol.2000563. Epub 2020 Sep 4. J Immunol. 2020. PMID: 32887748 Free PMC article.
-
Novel vaccination strategies against tuberculosis.Cold Spring Harb Perspect Med. 2014 Jun 2;4(6):a018523. doi: 10.1101/cshperspect.a018523. Cold Spring Harb Perspect Med. 2014. PMID: 24890836 Free PMC article. Review.
-
Therapeutic vaccination against relevant high virulence clinical isolates of Mycobacterium tuberculosis.Tuberculosis (Edinb). 2014 Mar;94(2):140-7. doi: 10.1016/j.tube.2013.08.010. Epub 2013 Sep 7. Tuberculosis (Edinb). 2014. PMID: 24295653 Free PMC article.
-
Rescuing ESAT-6 Specific CD4 T Cells From Terminal Differentiation Is Critical for Long-Term Control of Murine Mtb Infection.Front Immunol. 2020 Nov 6;11:585359. doi: 10.3389/fimmu.2020.585359. eCollection 2020. Front Immunol. 2020. PMID: 33240275 Free PMC article.
-
Evaluation of the overall IFN-γ and IL-17 pro-inflammatory responses after DNA therapy of tuberculosis.Hum Vaccin Immunother. 2013 May;9(5):1093-103. doi: 10.4161/hv.23417. Epub 2013 Jan 16. Hum Vaccin Immunother. 2013. PMID: 23324590 Free PMC article.
References
-
- Skeiky YA, Sadoff JC. Advances in tuberculosis vaccine strategies. Nat Rev Microbiol. 2006;4:469–76. - PubMed
-
- Kaufmann SH. Is the development of a new tuberculosis vaccine possible? Nat Med. 2000;6:955–60. - PubMed
-
- Orme IM. Preclinical testing of new vaccines for tuberculosis: a comprehensive review. Vaccine. 2006;24:2–19. - PubMed
Publication types
MeSH terms
Substances
Grants and funding
LinkOut - more resources
Full Text Sources
Other Literature Sources
Research Materials
Miscellaneous

