. 2009 May;83(10):4732-48.
doi: 10.1128/JVI.00111-09. Epub 2009 Mar 4.

NF-kappaB p50 plays distinct roles in the establishment and control of murine gammaherpesvirus 68 latency

Affiliations

NF-kappaB p50 plays distinct roles in the establishment and control of murine gammaherpesvirus 68 latency

Laurie T Krug et al. J Virol. 2009 May.

Abstract

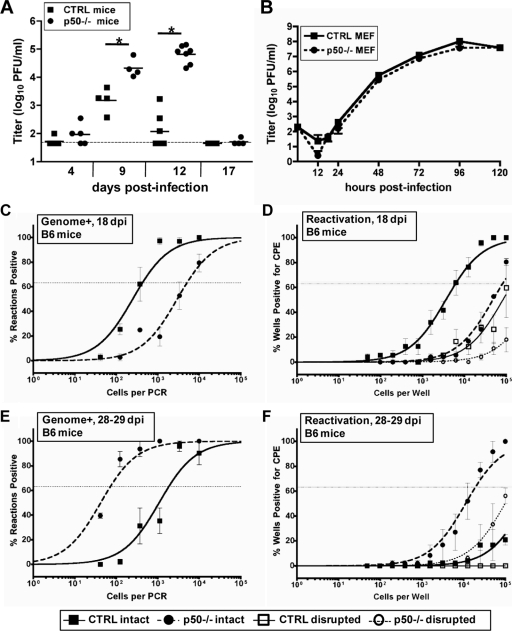
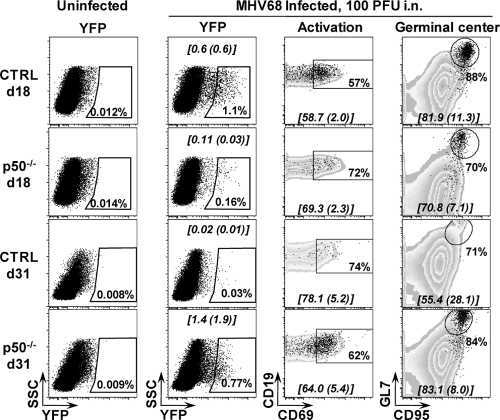
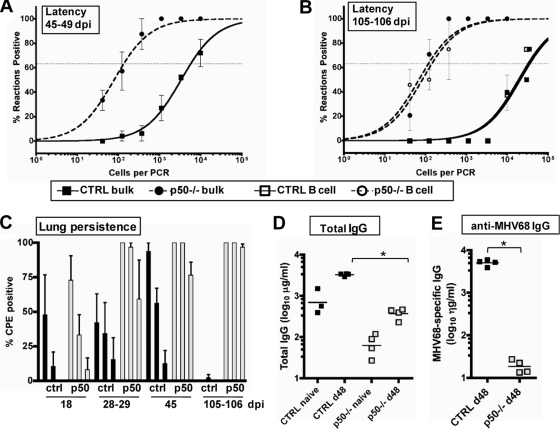
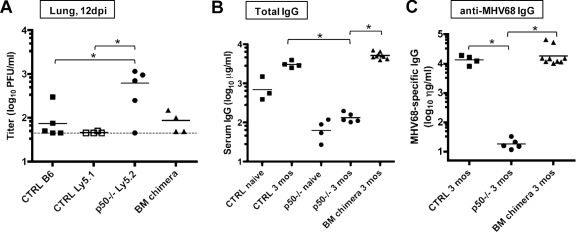
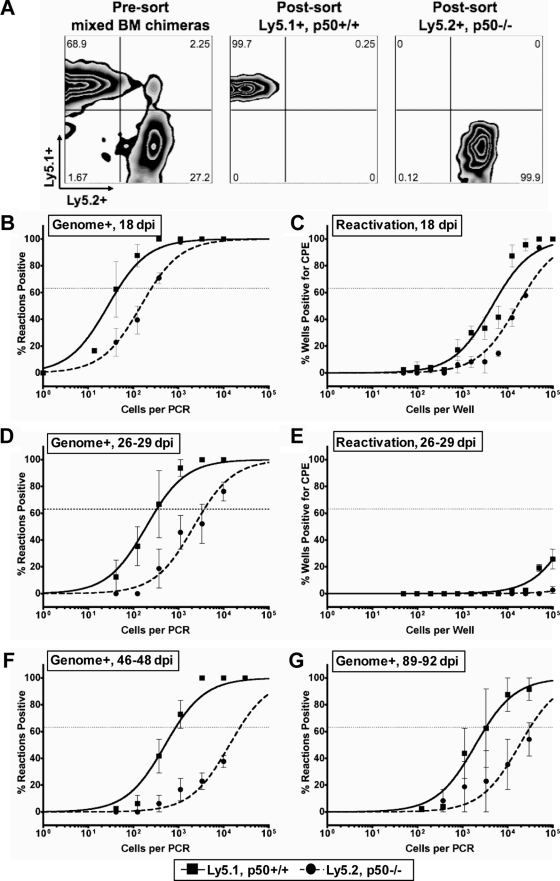
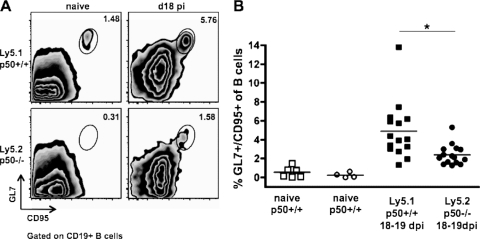
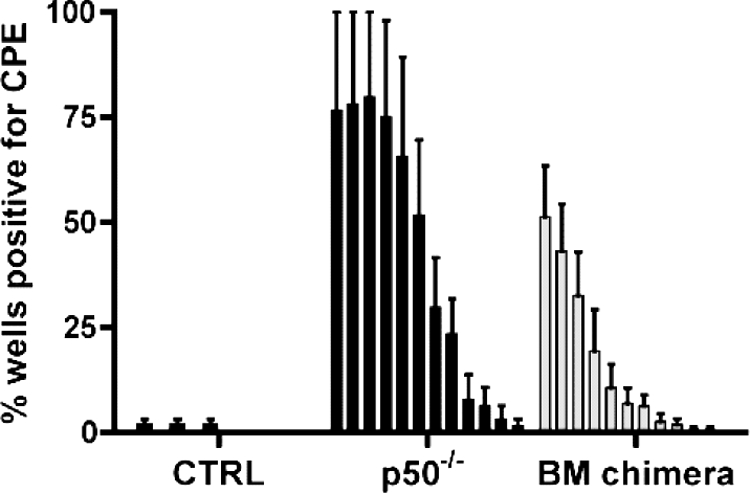
NF-kappaB signaling is critical to the survival and transformation of cells infected by the human gammaherpesviruses Epstein-Barr virus and Kaposi's sarcoma-associated herpesvirus. Here we have examined how elimination of the NF-kappaB transcription factor p50 from mice affects the life cycle of murine gammaherpesvirus 68 (MHV68). Notably, mice lacking p50 in every cell type were unable to establish a sufficiently robust immune response to control MHV68 infection, leading to high levels of latently infected B cells detected in the spleen and persistent virus replication in the lungs. The latter correlated with very low levels of virus-specific immunoglobulin G (IgG) in the infected p50(-/-) mice at day 48 postinfection. Because the confounding impact of the loss of p50 on the host response to MHV68 infection prevented a direct analysis of the role of this NF-kappaB family member on MHV68 latency in B cells, we generated and infected mixed p50(+/+)/p50(-/-) bone marrow chimeric mice. We show that the chimeric mice were able to control acute virus replication and exhibited normal levels of virus-specific IgG at 3 months postinfection, indicating the induction of a normal host immune response to MHV68 infection. However, in p50(+/+)/p50(-/-) chimeric mice the p50(-/-) B cells exhibited a significant defect compared to p50(+/+) B cells in supporting MHV68 latency. In addition to identifying a role for p50 in the establishment of latency, we determined that the absence of p50 in a subset of the hematopoietic compartment led to persistent virus replication in the lungs of the chimeric mice, providing evidence that p50 is required for controlling virus reactivation. Taken together, these data demonstrate that p50 is required for immune control by the host and has distinct tissue-dependent roles in the regulation of murine gammaherpesvirus latency during chronic infection.


Figures

FIG. 1.
FIG. 1.
NF-κB p50 is active during latent and lytic infection. EMSA analysis of NF-κB binding in MHV68-infected cells is shown. (A) Nuclear extracts were prepared from S11 cells, MHV68+ B-cell lymphoma cells, cultured under normal growth conditions. The molar fold excess of WT or mutant (mut) competitor and antibodies against NF-κB subunits for supershift analysis are indicated. (B) Nuclear extracts were prepared from primary MEFs infected at an MOI of 5.0 from 30 min to 24 h. PAA, phosphonoacetic acid treatment. (C) Identification of NF-κB subunits by supershift analysis of nuclear extracts from MEFs treated for 15 min with TNF-α or infected for 24 h. Antibodies against NF-κB subunits are indicated. CTRL and p50−/− reflect the nuclear extracts from MEFs of control and p50−/− mice on a C57BL/6 background, which were prepared and infected in parallel. Arrows point to specific complexes, brackets indicate supershifted complexes, and dots indicate nonspecific complexes.
FIG. 2.
FIG. 2.
Infection of NF-κB1 p50−/− mice with MHV68 results in elevated levels of acute replication in the lungs and a delay in the peak of splenic latency. (A) Acute replication in the lung. Control (CTRL, B6x129PF2/J) mice or NF-κB1 p50−/− (B6;129P) mice were infected with 100 PFU. On the indicated dpi, lungs were harvested and disrupted, and titers were determined on NIH 3T12 fibroblasts. The data were compiled from one or two experiments with three to five mice analyzed per experiment. Data are shown as log10 titer, and the bar indicates the geometric mean titer. The dashed line indicates the limit of detection of this assay as log101.7 or 50 PFU/ml of sample homogenate. Significant differences between CTRL and p50−/− mice at 9 dpi (P = 0.0060) and 12 dpi (P < 0.0001) were identified. (B) Multistep growth curve in MEFs isolated from CTRL or p50−/− mice infected with an MOI of 0.001 PFU per cell. Samples were harvested at the indicated time points, and titers were determined on NIH 3T12 cells. (C and D) Frequency of splenocytes harboring viral genomes. Splenocytes were harvested from control mice (CTRL, B6) or NF-κB1 p50−/− mice (B6) at the indicated dpi with 100 PFU of WT MHV68. Limiting-dilution viral genome PCR analysis was utilized to determine the frequency of latency for CTRL mice and p50−/− mice at 18 dpi (1/425 and 1/5,066, respectively; P = 0.0378) and 28 to 29 dpi (1/1,847 and 1/71, respectively). (E and F) Frequency of splenocytes reactivating virus. Splenocytes were harvested from control mice (CTRL, B6) or NF-κB1 p50−/− mice (p50−/−, B6) at the indicated dpi with 100 PFU of WT MHV68. Limiting-dilution reactivation analysis was utilized to determine the frequency of ex vivo reactivation for CTRL mice and p50−/− mice at 18 dpi (1/6,161 and 1/82,514, respectively; P < 0.0001) and 28 to 29 dpi (1/18,784 and <1/100,000, respectively). In parallel, as indicated by the open symbols, mechanically disrupted cells were plated to detect the presence of preformed infectious virus. For both limiting-dilution assays, curve fit lines were derived from nonlinear regression analysis, and symbols represent the mean percentage of wells positive for virus (viral DNA or CPE) ± the standard error of the mean. The dotted line represents 63.2%, from which the frequency of viral genome-positive cells or the frequency of cells reactivating virus was calculated based on the Poisson distribution. The data shown represent at least two independent experiments with spleen cells pooled from three to five mice per experimental group.
FIG. 3.
FIG. 3.
MHV68-eYFP gains access to similar B-cell reservoirs in p50−/− mice and control C57/BL6 mice. Cells were prepared from spleens harvested from uninfected age-matched (naïve) mice or from three to five mice that were infected 18 or 31 days prior to harvest with 100 PFU of MHV68-eYFP. Subsets were derived from initial FACS gating on live lymphocyte populations, CD19+, and then eYFP+. Activated cells were gated on CD19+/YFP+/CD69hi. Germinal center cells were gated on CD19+/YFP+/GL7hi/CD95hi. The data in the gated populations are the percentage of YFP+ cells that fall within the gate and are shown for a representative mouse. The means and standard deviations for these subsets are shown on each flow plot in brackets and were determined from the analysis of three infected mice.
FIG. 4.
FIG. 4.
Hyperestablishment of splenic latency and persistence in the lungs is associated with a lack of serum IgG against MHV68 in NF-κB1 p50−/− mice. (A) Frequency of splenocytes harboring viral genomes at 45 to 49 dpi. Bulk splenocytes were prepared from two sets of control mice (CTRL, B6 and B6x129PF2/J) or NF-κB1 p50−/− mice (p50−/−, B6 and B6;129P) infected with 100 PFU of WT MHV68. Limiting-dilution viral genome PCR analysis was utilized to determine the frequency of latency for bulk splenocytes from CTRL mice and p50−/− mice at 45 to 49 dpi (1/5,685 and 1/135, respectively). (B) Frequency of splenocytes harboring viral genomes at 105 to 106 dpi. Bulk splenocytes and CD19+ B cells were prepared from control mice (CTRL, B6) or NF-κB1 p50−/− mice (p50−/−, B6) with 100 PFU of WT MHV68. Limiting-dilution viral genome PCR analysis was utilized to determine the frequency of latency for bulk splenocytes from CTRL mice and p50−/− mice at 105 to 106 dpi (1/35,950 and 1/118, respectively) and for B cells (1/32,500 and 1/142, respectively). Postseparation FACS analysis indicated that the mean purities for CD19+ cells were 93% ± 2.1% for CTRL and 91.4% ± 0.1% for p50−/−. Curve fit lines were derived from nonlinear regression analysis, and symbols represent the mean percentage of wells positive for viral DNA ± the standard error of the mean. The dashed line represents 63.2%, from which the frequency of viral genome-positive cells was calculated based on the Poisson distribution. The data shown represent at least two independent experiments with spleen cells pooled from three to five mice per experimental group. (C) Persistence in the lungs. Lung tissue was isolated from three or four infected control mice (CTRL, BL6) or NF-κB1 p50−/− mice (p50−/−, BL6) at the indicated dpi with 100 PFU of WT MHV68. Bars for each sample represent the mean percentage for 16 wells positive for CPE upon plating fourfold dilutions (1:10, 1:40, and 1:160) of mechanically disrupted lung tissue from an individual mouse on an indicator MEF monolayer. (D) Determination of total IgG production in sera of individual naïve versus infected CTRL and p50−/− mice. The bar represents the geometric mean titer. The mean total IgG was significantly different for comparisons of naïve or infected sera within or between CTRL and p50−/− mice (P < 0.006). (E) Determination of MHV68-specific IgG production in sera of individual infected mice. The bar represents the geometric mean titer. Naïve sera from both strains of mice had undetectable levels of MHV68-specific IgG (data not shown). The mean anti-MHV68 IgG titer was significantly different (P < 0.0001).
FIG. 5.
FIG. 5.
Mixed BM p50+/+/p50−/− chimeric mice have restored control of acute replication and normal IgG responses. (A) Acute replication in the lung. Control mice on a C57BL/6 or Ly5.1 background, NF-κB1 p50−/− mice (BL6), and mixed BM p50+/+/p50−/− mice were infected with 100 PFU. At 12 dpi, lungs were harvested and disrupted, and titers were determined on NIH 3T12 fibroblasts. Data from individual mice are shown as log10 titer, and the bar indicates the geometric mean titer. The dashed line indicates the limit of detection of this assay as log101.7 or 50 PFU/ml of sample homogenate. Significant differences were identified between CTRL (B6 and Ly5.1) and p50−/− (P < 0.05) mice. (B) Determination of total IgG production in sera of individual naïve versus infected mice. The bar represents the geometric mean titer. Infected CTRL mice and BM chimeras differed significantly from naïve CTRL mice (P < 0.008). (C) Determination of MHV68-specific IgG production in sera of individual infected mice. The bar represents the geometric mean titer. Naïve sera had undetectable levels of MHV68-specific IgG (data not shown). Infected CTRL mice and BM chimeras differed significantly from p50−/− mice (P < 0.0008 and P = 0.0306, respectively).
FIG. 6.
FIG. 6.
NF-κB1 p50 null B cells are poor reservoirs for MHV68 latency in mixed BM chimeras. (A) Representative flow cytometric analysis of cell populations of p50+/+/p50−/− mixed BM chimeras before and after sorting. Eight weeks after reconstitution of wild-type Ly5.1+ mice with a 7:3 ratio of Ly5.1+ WT to Ly5.2+ p50−/− hematopoietic cells, BM chimeric mice were infected with 100 PFU of MHV68. At the indicated times below, splenocytes were harvested and then stained with anti-CD19-PE, anti-Ly5.1-FITC, and anti-Ly5.2-APC and sorted into p50+/+, Ly5.1+, and p50−/− Ly5.2+ B-cell populations. Postsort FACS analysis indicated that the mean purities were 99.8% ± 0.2% for p50+/+ Ly5.1+ CD19+ cells and 99.3% ± 0.6% for p50−/− Ly5.2+ cells. (B, D, F, and G) Frequency of sorted p50+/+ and p50−/− CD19+ B cells harboring viral genomes. Limiting-dilution viral genome PCR analysis was utilized to determine the frequency of latency in p50+/+ and p50−/− B cells at 18 dpi (1/46 and 1/255), 26 to 29 dpi (1/330 and 1/3,727), 46 to 48 dpi (1/679 and 1/16,238), and 89 to 92 dpi (1/3,418 and 1/30,634). (C and E) Frequency of sorted p50+/+ and p50−/− CD19+ B cells reactivating virus. Limiting-dilution reactivation analysis was utilized to determine the frequency of ex vivo reactivation in p50+/+ and p50−/− B cells at 18 dpi (1/7,876 and 1/28,065) and 26 to 29 dpi (below the limit of detection). For both limiting-dilution assays, curve fit lines were derived from nonlinear regression analysis, and symbols represent the mean percentage of wells positive for virus (viral DNA or CPE) ± the standard error of the mean. The dashed line represents 63.2%, from which the frequency of viral genome-positive cells or the frequency of cells reactivating virus was calculated based on the Poisson distribution. The data shown represent two independent experiments with spleen cells pooled from three to five mice per experimental group.
FIG. 7.
FIG. 7.
B cells lacking NF-κB1 p50 in the BM chimeras have defective responses to MHV68 infection. Cells were prepared from spleens harvested from uninfected age-matched (naïve) mice or from two independent sets of infected p50+/+/p50−/− mixed BM chimeric mice at 18 to 19 dpi with 100 PFU of WT MHV68. Splenocytes from individual mice were stained with anti-Ly5.1-APC, anti-Ly5.2-peridinin chlorophyll protein-Cy5.5, anti-GL7-FITC, and anti-CD95-PE and then analyzed by flow cytometry. (A) Representative flow cytometry plots of the germinal center B-cell population (percent GL7+/CD95+ of CD19+) in naïve and infected p50+/+ versus p50−/− subsets. (B) Scatter plot of germinal center cells in each population, compiled from two independent sets of infected BM chimeras. Each symbol represents data from an individual mouse, and the bar depicts the mean percentage. One of two representative experiments is shown. All comparisons except for the percent differences of naïve p50−/− and p50+/+ germinal center B cells are statistically significant (P < 0.01); *, P = 0.0052.
FIG. 8.
FIG. 8.
MHV68 replication persists in the lungs of mice harboring a subset of p50−/− hematopoietic cells at 3 months postinfection. Lung tissue was isolated from infected control mice (CTRL, BL6), NF-κB1 p50−/− mice (p50−/−, BL6), or p50+/+/p50−/− BM chimeric mice at 3 months postinfection with 100 PFU of WT MHV68. Bars for each sample represent the percentage for 16 wells positive for CPE upon plating twofold serial dilutions (starting at 1:10) of mechanically disrupted lung tissue on an indicator MEF monolayer.

Similar articles

Cited by

References

    1. An, J., Y. Sun, R. Sun, and M. B. Rettig. 2003. Kaposi's sarcoma-associated herpesvirus encoded vFLIP induces cellular IL-6 expression: the role of the NF-kappaB and JNK/AP1 pathways. Oncogene 223371-3385. - PubMed
    1. Artis, D., K. Speirs, K. Joyce, M. Goldschmidt, J. Caamaño, C. A. Hunter, and P. Scott. 2003. NF-kappa B1 is required for optimal CD4+ Th1 cell development and resistance to Leishmania major. J. Immunol. 1701995-2003. - PubMed
    1. Arvanitakis, L., E. Geras-Raaka, A. Varma, M. C. Gershengorn, and E. Cesarman. 1997. Human herpesvirus KSHV encodes a constitutively active G-protein-coupled receptor linked to cell proliferation. Nature 385347-350. - PubMed
    1. Barton, E. S., M. L. Lutzke, R. Rochford, and H. W. T. Virgin. 2005. Alpha/beta interferons regulate murine gammaherpesvirus latent gene expression and reactivation from latency. J. Virol. 7914149-14160. - PMC - PubMed
    1. Beinke, S., and S. C. Ley. 2004. Functions of NF-kappaB1 and NF-kappaB2 in immune cell biology. Biochem. J. 382393-409. - PMC - PubMed

Publication types

MeSH terms