Stromal cell-mediated suppression of human T-cell leukemia virus type 1 expression in vitro and in vivo by type I interferon
- PMID: 19264779
- PMCID: PMC2682107
- DOI: 10.1128/JVI.02564-08
Stromal cell-mediated suppression of human T-cell leukemia virus type 1 expression in vitro and in vivo by type I interferon
Abstract
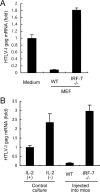
Human T-cell leukemia virus type 1 (HTLV-1) causes adult T-cell leukemia (ATL), HTLV-1-associated myelopathy/tropical spastic paraparesis, and other inflammatory diseases. Despite such severe outcomes of HTLV-1 infection, the level of HTLV-1 expression in vivo is very low and rapidly increases after transfer of cells to culture conditions. The mechanisms of this phenomenon have remained obscure. In the present study, we found that human and mouse stromal cells, such as epithelial cells and fibroblasts, suppressed HTLV-1 expression in ATL and non-ATL HTLV-1-infected cells. HTLV-1 mRNA and proteins in HTLV-1-infected cells markedly decreased upon coculture with human epithelial-like cells (HEK293T) or mouse embryo fibroblasts (NIH 3T3). When infected cells were reisolated from the cocultures, viral expression was restored to the original level over the following 48 h. Spontaneous induction of HTLV-1 expression in primary ATL cells in the first 24 h of culture was also inhibited by coculture with HEK293T cells. Coculture of HTLV-1-infected cells and HEK293T cells induced type I interferon responses, as detected by beta interferon (IFN-beta) promoter activation and IFN-stimulated gene upregulation. HEK293T-mediated suppression of HTLV-1 expression was partly inhibited by antibodies to human IFN-alpha/beta receptor. NIH 3T3-mediated suppression was markedly abrogated by neutralizing antibodies to mouse IFN-beta. Furthermore, viral expression in HTLV-1-infected cells was significantly suppressed when the infected cells were intraperitoneally injected into wild-type mice but not IFN regulatory factor 7 knockout mice that are deficient of type I IFN responses. These findings indicate that the innate immune system suppresses HTLV-1 expression in vivo, at least through type I IFN.
Figures


Similar articles
-
Impact of host immunity on HTLV-1 pathogenesis: potential of Tax-targeted immunotherapy against ATL.Retrovirology. 2019 Aug 22;16(1):23. doi: 10.1186/s12977-019-0484-z. Retrovirology. 2019. PMID: 31438973 Free PMC article. Review.
-
Interferon-α (IFN-α) suppresses HTLV-1 gene expression and cell cycling, while IFN-α combined with zidovudine induces p53 signaling and apoptosis in HTLV-1-infected cells.Retrovirology. 2013 May 20;10:52. doi: 10.1186/1742-4690-10-52. Retrovirology. 2013. PMID: 23688327 Free PMC article.
-
Suppression of Type I Interferon Production by Human T-Cell Leukemia Virus Type 1 Oncoprotein Tax through Inhibition of IRF3 Phosphorylation.J Virol. 2016 Mar 28;90(8):3902-3912. doi: 10.1128/JVI.00129-16. Print 2016 Apr. J Virol. 2016. PMID: 26819312 Free PMC article.
-
Induction of IL-10- and IFN-gamma-producing T-cell responses by autoreactive T-cells expressing human T-cell leukemia virus type I Tax.Int Immunol. 2009 Sep;21(9):1089-100. doi: 10.1093/intimm/dxp074. Epub 2009 Aug 4. Int Immunol. 2009. PMID: 19654198
-
Modulation of innate immune responses during human T-cell leukemia virus (HTLV-1) pathogenesis.Cytokine Growth Factor Rev. 2011 Aug;22(4):197-210. doi: 10.1016/j.cytogfr.2011.08.002. Epub 2011 Sep 15. Cytokine Growth Factor Rev. 2011. PMID: 21924945 Review.
Cited by
-
Impact of host immunity on HTLV-1 pathogenesis: potential of Tax-targeted immunotherapy against ATL.Retrovirology. 2019 Aug 22;16(1):23. doi: 10.1186/s12977-019-0484-z. Retrovirology. 2019. PMID: 31438973 Free PMC article. Review.
-
Is the HTLV-1 Retrovirus Targeted by Host Restriction Factors?Viruses. 2022 Jul 23;14(8):1611. doi: 10.3390/v14081611. Viruses. 2022. PMID: 35893677 Free PMC article. Review.
-
Manipulation of Type I Interferon Signaling by HIV and AIDS-Associated Viruses.J Immunol Res. 2019 Apr 4;2019:8685312. doi: 10.1155/2019/8685312. eCollection 2019. J Immunol Res. 2019. PMID: 31089479 Free PMC article. Review.
-
Interferon-α (IFN-α) suppresses HTLV-1 gene expression and cell cycling, while IFN-α combined with zidovudine induces p53 signaling and apoptosis in HTLV-1-infected cells.Retrovirology. 2013 May 20;10:52. doi: 10.1186/1742-4690-10-52. Retrovirology. 2013. PMID: 23688327 Free PMC article.
-
Immunopathogenesis of human T-cell leukemia virus type-1-associated myelopathy/tropical spastic paraparesis: recent perspectives.Leuk Res Treatment. 2012;2012:259045. doi: 10.1155/2012/259045. Epub 2012 Feb 6. Leuk Res Treatment. 2012. PMID: 23198155 Free PMC article.
References
-
- Bangham, C. R., and M. Osame. 2005. Cellular immune response to HTLV-1. Oncogene 246035-6046. - PubMed
-
- Gessain, A., F. Barin, J. C. Vernant, O. Gout, L. Maurs, A. Calender, and G. de The. 1985. Antibodies to human T-lymphotropic virus type-I in patients with tropical spastic paraparesis. Lancet ii407-410. - PubMed
Publication types
MeSH terms
Substances
LinkOut - more resources
Full Text Sources
Molecular Biology Databases
Research Materials

