. 2009 May;83(10):5014-27.
doi: 10.1128/JVI.02264-08. Epub 2009 Mar 4.

c-Myc and Rel/NF-kappaB are the two master transcriptional systems activated in the latency III program of Epstein-Barr virus-immortalized B cells

Affiliations

c-Myc and Rel/NF-kappaB are the two master transcriptional systems activated in the latency III program of Epstein-Barr virus-immortalized B cells

Nathalie Faumont et al. J Virol. 2009 May.

Abstract

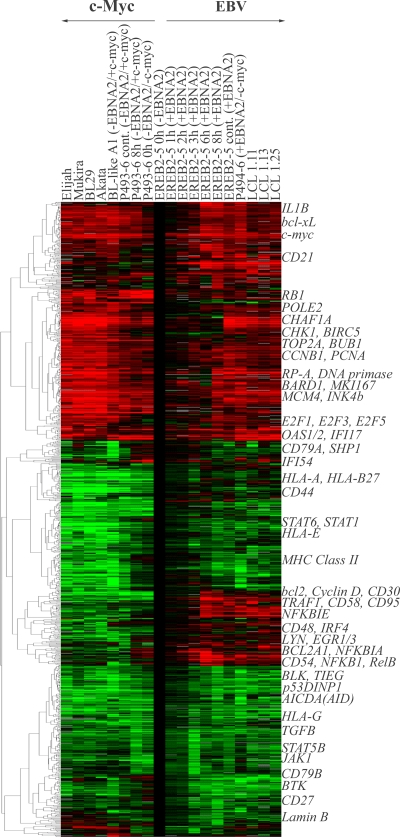
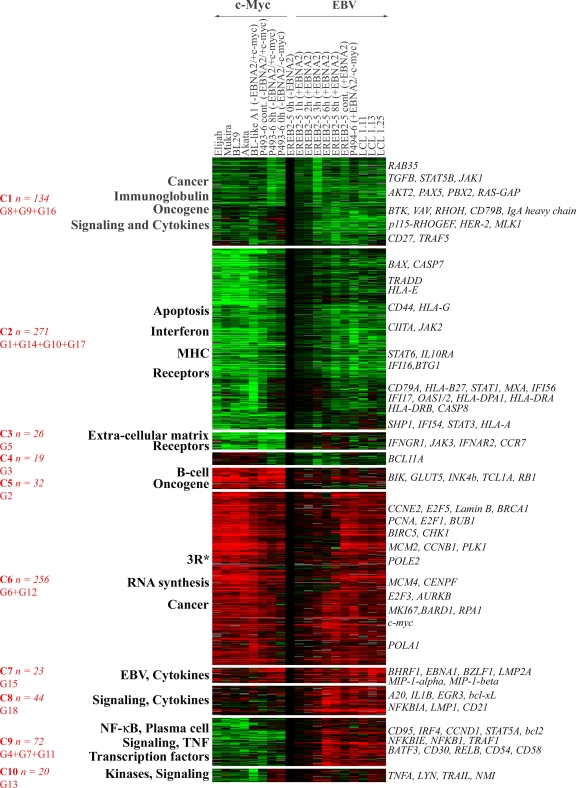
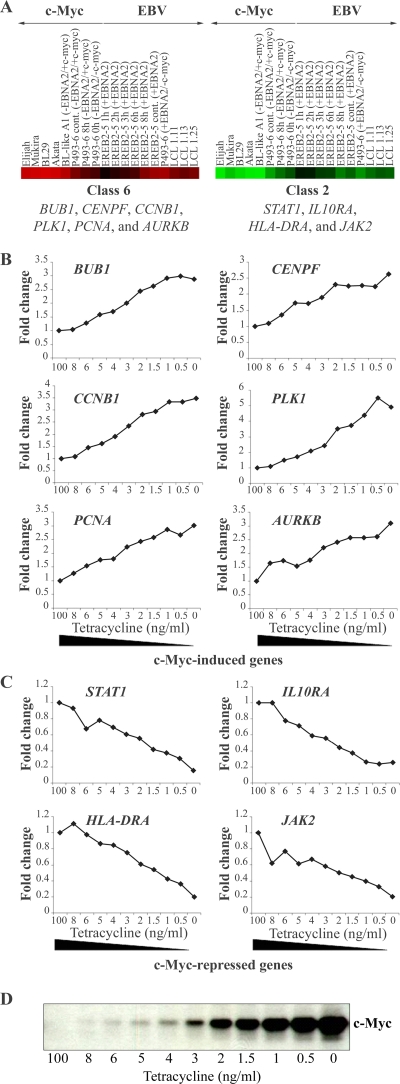
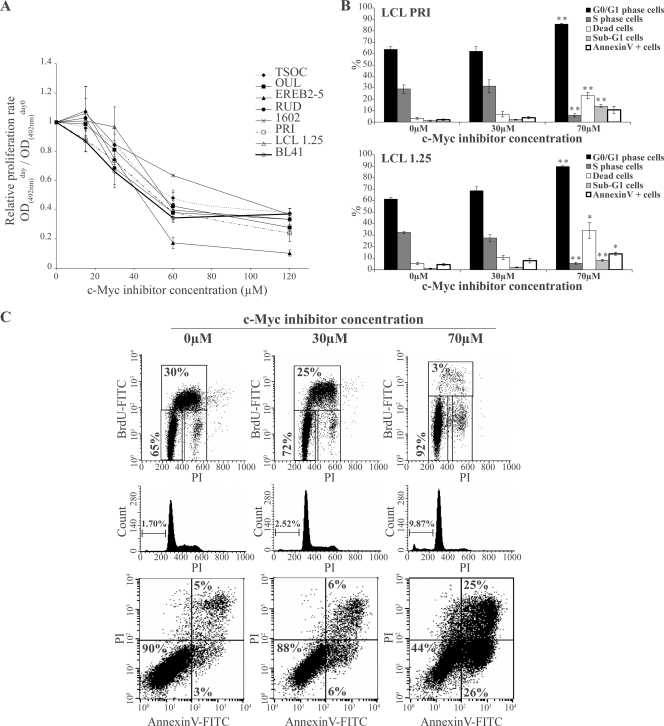
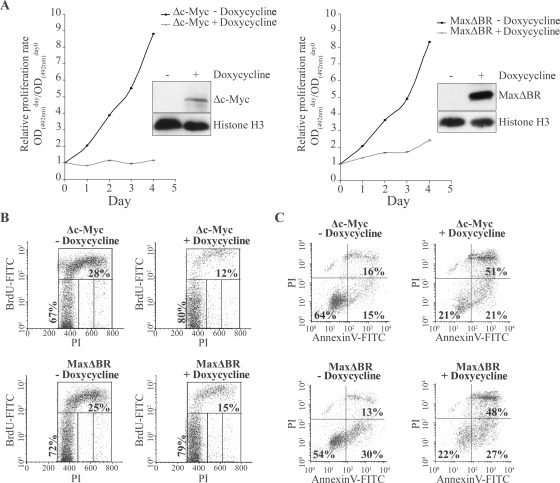
The Epstein-Barr virus (EBV) latency III program imposed by EBNA2 and LMP1 is directly responsible for immortalization of B cells in vitro and is thought to mediate most immunodeficiency-related posttransplant lymphoproliferative diseases in vivo. To answer the question whether and how this proliferation program is related to c-Myc, we have established the transcriptome of both c-Myc and EBV latency III proliferation programs using a Lymphochip specialized microarray. In addition to EBV-positive latency I Burkitt lymphoma lines and lymphoblastoid cell lines (LCLs), we used an LCL expressing an estrogen-regulatable EBNA2 fusion protein (EREB2-5) and derivative B-cell lines expressing a constitutively active or tetracycline-regulatable c-myc gene. A total of 897 genes were found to be fourfold or more up- or downregulated in either one or both proliferation programs compared to the expression profile of resting EREB2-5 cells. A total of 661 (74%) of these were regulated similarly in both programs. Numerous repressed genes were known targets of STAT1, and most induced genes were known to be upregulated by c-Myc and to be involved in cell proliferation. In keeping with the gene expression patterns, inactivation of c-Myc by a chemical inhibitor or by conditional expression of dominant-negative c-Myc and Max mutants led to proliferation arrest of LCLs. Most genes differently regulated in both proliferation programs corresponded to genes induced by NF-kappaB in LCLs, and many of them coded for immunoregulatory and/or antiapoptotic molecules. Thus, c-Myc and NF-kappaB are the two main transcription factors responsible for the phenotype, growth pattern, and biological properties of cells driven into proliferation by EBV.


Figures

FIG. 1.
FIG. 1.
Hierarchical clustering of the 897 genes selected. Duplicates were eliminated by selection of the sequence corresponding to the median of all the sequences of the same gene. Then, filtering was performed by selection of genes with at least a fourfold change in at least one of the cell conditions compared to estrogen deprived EREB2-5 cells as a model of resting G1 B cells (EREB2-5 cells at 0 h in the absence of EBNA2). Culture conditions are given at the top of the panel and indicate the cell line, number of hours of treatment (cont, continuously), and the presence (+) or absence (−) of EBNA2 and/or c-Myc. Expression levels are shown in red (induced) and green (repressed) relative to the expression level of arrested EREB2-5 cells. Representative genes of an expression profile cluster are indicated on the right-hand side. MHC, major histocompatibility complex.
FIG. 2.
FIG. 2.
Results of the first step of K-mean clustering. The 897 selected genes were initially divided in 18 groups, G1 to G18, using the K-mean clustering method. The K-mean groups for which the Pearson correlation coefficient was above 0.9 were aggregated 2 by 2. Then, the closest groups were aggregated 2 by 2 either after hierarchical clustering or principal component analysis. The choice between both methods was given by the maximum increase of absolute value of χ2. This was repeated until the maximum of the χ2 value was obtained. Proximity of the groups was graphically visualized by hierarchical clustering and principal component analysis. (A) Hierarchical clustering (upper panel) and principal component analysis (lower panel) of the 18 groups G1 to G18. (B) Hierarchical clustering (upper panel) and principal component analysis (lower panel) of the 10 merged classes (C1 to C10). Culture conditions are given at the tops of the panels and indicate the cell line, number of hours of treatment (cont, continuously), and the presence (+) or absence (−) of EBNA2 and/or c-Myc.
FIG. 3.
FIG. 3.
Expression profile of the 10 K-mean classes. Each K-mean class of Fig. 2B was clustered in a hierarchical manner. The expression profile was obtained with the Treeview program. Overrepresented functions are annotated on the left. Some putatively interesting genes are annotated on the right. The merged classes and the number of genes are indicated in red. 3R, genes involved in DNA replication, repair, and/or recombination. Culture conditions are given at the top of the panel and indicate the cell line, number of hours of treatment (cont, continuously), and the presence (+) or absence (−) of EBNA2 and/or c-Myc. MHC, major histocompatibility complex.
FIG. 4.
FIG. 4.
Validation of c-Myc-regulated target genes identified on the Lymphochip cDNA array (C6 and C2) by nylon filter hybridization. (A) Six individual genes (bub1, cenpf, ccnb1, plk1, pcna, and aurkb) of C6 and four individual genes (stat1, il10ra, hla-dra, and jak2) of C2 were selected as representative genes present on the Lymphochip and on nylon filters. Culture conditions are given at the top of the panel and indicate the cell line, number of hours of treatment (cont, continuously), and the presence (+) or absence (−) of EBNA2 and/or c-Myc. (B and C) RNAs were isolated from P493-6 cells treated with different concentrations of tetracycline (0 to 8 ng/ml and 100 ng/ml), reverse transcribed into 33P-labeled cDNA, and hybridized to the filters. The expression was quantified, and the expression levels of the selected genes at the highest tetracycline concentration (100 ng/ml) were set to 1. The relative change is presented as a function of tetracycline concentration corresponding inversely to the c-Myc concentration. The expression levels of positively regulated and negatively regulated c-Myc targets are shown in panels B and C, respectively. (D) The relative change is presented as a function of tetracycline concentration corresponding inversely to the c-Myc protein concentration as revealed by immunoblotting. A clear dose response of the expression of the selected genes to different tetracycline concentrations indicates that the genes are regulated directly or indirectly by c-Myc.
FIG. 5.
FIG. 5.
Effect of a synthetic c-Myc inhibitor on proliferation of LCL cells. (A) Both EBV-negative BL41 cells and the LCLs TSOC, OUL, EREB2-5, RUD, 1602, PRI, and 1.25 were treated for 48 h with increasing concentrations (15 to 120 μM) of the synthetic inhibitor 10058-F4. At day 0, 1.5 × 10⁴untreated and treated cells were seeded into wells of 96-wells plates. The relative proliferation rate was assayed using a colorimetric method as described in Materials and Methods. (B) The LCL PRI (upper panel) and 1.25 (lower panel) cells at 1.5 × 10⁴ cells/ml were treated for 48 h with 30 μM and 70 μM 10058-F4 leading to 20% and 80% inhibition of proliferation, respectively. The G0/G1 and S phases of the cell cycle were assayed by flow cytometry after BrdU incorporation (FITC) and PI staining of DNA content. Apoptosis was assayed by measuring percentages of cells with a decreased DNA content (sub-G1 cells) and having externalized phosphatidylserines (annexin V-positive and PI-negative cells). The dead cells represent apoptotic (annexin V-positive and PI-negative cells) plus necrotic cells (PI-positive cells). Similar results were obtained with the EREB2-5 cells (data not shown). Error bars indicate standard error from the mean from three independent sets of experiments. A significant difference with a P value of <0.05 (*) or <0.01 (**) compared to untreated control cells using a Student's t test is indicated. (C) A typical flow cytometry result of the effect of the synthetic c-Myc inhibitor 10058-F4 on proliferation and cell death of LCL 1.25 cells. BrdU-FITC/PI biparametric graphs are shown in the top panels (the different regions were set up in the valleys separating each phase of the cell cycle because of an increase in autofluorescence after treatment of cells with 10058-F4). Middle panels show a sub-G1 peak assay. Lower panels are annexin V-FITC/PI biparametric graphs. Concentrations of 10058-F4 are indicated at the top of the set of graphs, and informative percentages are indicated in each graph. OD, optical density.
FIG. 6.
FIG. 6.
Effect of functional repression of c-Myc on proliferation of LCL cells. PRI-LCL was stably transfected with the inducible vector pRT-1 which contains cDNA coding for dominant-negative mutants of c-Myc or Max, named Δc-Myc and MaxΔBR, respectively. After 24 h (day 0) of doxycycline induction, the NGFR-t-expressing cells were purified by cell sorting. (A) At day 0, 1.5 × 10⁴untreated cells (−Doxycycline) and doxycycline treated cells (+Doxycycline) were seeded into wells of 96-wells plates. The following days, the number of viable cells was measured using a colorimetric method as described in Materials and Methods. Cells were harvested, and whole-cell extracts were subjected to immunoblotting analysis with anti-HA tag and anti-histone H3 antibodies. (B) At day 2, cells were pulse labeled with BrdU for the last 3 h, fixed, and stained with FITC-conjugated anti-BrdU mouse MAb and PI. BrdU uptake (FITC) versus DNA content (PI) was evaluated by flow cytometry. Representative density plots are shown. PI and FITC fluorescence intensities are plotted on the x and y axes, respectively. (C) At day 2, cells were doubly stained with annexin V-FITC and PI and then analyzed by flow cytometry. FITC and PI fluorescence intensities are plotted on the x and y axes, respectively. Informative percentages are indicated in each graph. Representative density plots are shown. OD, optical density.

Similar articles

Cited by

References

    1. Alizadeh, A. A., M. B. Eisen, R. E. Davis, C. Ma, I. S. Lossos, A. Rosenwald, J. C. Boldrick, H. Sabet, T. Tran, X. Yu, J. I. Powell, L. Yang, G. E. Marti, T. Moore, J. Hudson, Jr., L. Lu, D. B. Lewis, R. Tibshirani, G. Sherlock, W. C. Chan, T. C. Greiner, D. D. Weisenburger, J. O. Armitage, R. Warnke, R. Levy, W. Wilson, M. R. Grever, J. C. Byrd, D. Botstein, P. O. Brown, and L. M. Staudt. 2000. Distinct types of diffuse large B-cell lymphoma identified by gene expression profiling. Nature 403503-511. - PubMed
    1. Anderson, L. J., and R. Longnecker. 2008. An auto-regulatory loop for EBV LMP2A involves activation of Notch. Virology 371257-266. - PMC - PubMed
    1. Baran-Marszak, F., J. Feuillard, I. Najjar, C. Le Clorennec, J. M. Bechet, I. Dusanter-Fourt, G. W. Bornkamm, M. Raphael, and R. Fagard. 2004. Differential roles of STAT1α and STAT1β in fludarabine-induced cell cycle arrest and apoptosis in human B cells. Blood 1042475-2483. - PubMed
    1. Bornkamm, G. W., C. Berens, C. Kuklik-Roos, J. M. Bechet, G. Laux, J. Bachl, M. Korndoerfer, M. Schlee, M. Holzel, A. Malamoussi, R. D. Chapman, F. Nimmerjahn, J. Mautner, W. Hillen, H. Bujard, and J. Feuillard. 2005. Stringent doxycycline-dependent control of gene activities using an episomal one-vector system. Nucleic Acids Res. 33e137. - PMC - PubMed
    1. Bornkamm, G. W., and W. Hammerschmidt. 2001. Molecular virology of Epstein-Barr virus. Philos. Trans. R. Soc. Lond. B 356437-459. - PMC - PubMed

Publication types

MeSH terms