Retinal expression of Fgf2 in RCS rats with subretinal microphotodiode array
- PMID: 19264883
- PMCID: PMC2830719
- DOI: 10.1167/iovs.08-2072
Retinal expression of Fgf2 in RCS rats with subretinal microphotodiode array
Abstract
Purpose: To test the hypothesis that subretinal electrical stimulation from a microphotodiode array (MPA) exerts a neuroprotective effect in Royal College of Surgeons (RCS) rats through the induction of growth factors.
Methods: At postnatal day 21, RCS rats were divided into four groups in which one eye per rat received treatment: (A) active MPA, (M) minimally active MPA, (S) sham surgery, or (C) no surgery and the opposite eye was unoperated. Dark- and light-adapted ERGs were recorded 1 week after surgery. A second set of A-, M-, and C-treated RCS rats had weekly ERG recordings for 4 weeks. Real-time RT-PCR was used to measure relative expression of mRNAs (Bdnf, Fgf2, Fgf1, Cntf, Gdnf, and Igf1) in retina samples collected 2 days after the final ERG.
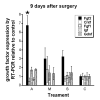
Results: One week after surgery, there was a slight difference in dark-adapted ERG b-wave at the brightest flash intensity. Mean retinal Fgf2 expression in the treated eye relative to the opposite eye was greater for the A group (4.67 +/- 0.72) than for the M group (2.80 +/- 0.45; P = 0.0501), S group (2.03 +/- 0.45; P < 0.01), and C group (1.30 +/- 0.22; P < 0.001). No significant change was detected for Bdnf, Cntf, Fgf1, Gdnf, and Igf1. Four weeks after surgery, the A group had significantly larger dark- and light-adapted ERG b-waves than for the M and C groups (P < 0.01). Simultaneously, mean relative Fgf2 expression was again greater for the A group (3.28 +/- 0.61) than for the M (1.28 +/- 0.32; P < 0.05) and C (1.05 +/- 0.04; P < 0.05) groups.
Conclusions: The results show subretinal implantation of an MPA induces selective expression of Fgf2 above that expected from a retina-piercing injury. Preservation of ERG b-wave amplitude 4 weeks after implantation is accompanied by elevated Fgf2 expression. These results suggest that Fgf2 may play a role in the neuroprotection provided by subretinal electrical stimulation.
Figures


Similar articles
-
Effects of subretinal electrical stimulation in mer-KO mice.Invest Ophthalmol Vis Sci. 2011 Jun 13;52(7):4223-30. doi: 10.1167/iovs.10-6750. Invest Ophthalmol Vis Sci. 2011. PMID: 21467171 Free PMC article.
-
Subretinal electrical stimulation preserves inner retinal function in RCS rat retina.Mol Vis. 2013 May 6;19:995-1005. Print 2013. Mol Vis. 2013. PMID: 23687436 Free PMC article.
-
Neuroprotective effect of subretinal implants in the RCS rat.Invest Ophthalmol Vis Sci. 2005 Feb;46(2):674-82. doi: 10.1167/iovs.04-0515. Invest Ophthalmol Vis Sci. 2005. PMID: 15671299
-
Corneal electroretinographic function rescued by normal retinal pigment epithelial grafts in retinal degenerative Royal College of Surgeons rats.Invest Ophthalmol Vis Sci. 1994 Dec;35(13):4300-9. Invest Ophthalmol Vis Sci. 1994. PMID: 8002250
-
The development of subretinal microphotodiodes for replacement of degenerated photoreceptors.Ophthalmic Res. 1997;29(5):269-80. doi: 10.1159/000268025. Ophthalmic Res. 1997. PMID: 9323718 Review.
Cited by
-
Neuroprotective dose response in RCS rats implanted with microphotodiode arrays.Adv Exp Med Biol. 2012;723:115-20. doi: 10.1007/978-1-4614-0631-0_16. Adv Exp Med Biol. 2012. PMID: 22183323 Free PMC article.
-
The artificial silicon retina in retinitis pigmentosa patients (an American Ophthalmological Association thesis).Trans Am Ophthalmol Soc. 2010 Dec;108:120-54. Trans Am Ophthalmol Soc. 2010. PMID: 21212852 Free PMC article.
-
Exploratory clinical trial to evaluate the efficacy and safety of transdermal electrical stimulation in patients with central retinal artery occlusion.PLoS One. 2023 Feb 24;18(2):e0282003. doi: 10.1371/journal.pone.0282003. eCollection 2023. PLoS One. 2023. PMID: 36827287 Free PMC article. Clinical Trial.
-
Effects of subretinal electrical stimulation in mer-KO mice.Invest Ophthalmol Vis Sci. 2011 Jun 13;52(7):4223-30. doi: 10.1167/iovs.10-6750. Invest Ophthalmol Vis Sci. 2011. PMID: 21467171 Free PMC article.
-
Visual field changes following implantation of the Argus II retinal prosthesis.Graefes Arch Clin Exp Ophthalmol. 2015 Feb;253(2):323-5. doi: 10.1007/s00417-014-2822-0. Epub 2014 Nov 30. Graefes Arch Clin Exp Ophthalmol. 2015. PMID: 25432093 Clinical Trial. No abstract available.
References
-
- Haim M. Epidemiology of retinitis pigmentosa in Denmark. Acta Ophthalmol Scand Suppl. 2002:1–34. - PubMed
-
- Koenekoop RK, Lopez I, den Hollander AI, Allikmets R, Cremers FP. Genetic testing for retinal dystrophies and dysfunctions: benefits, dilemmas and solutions. Clin Experiment Ophthalmol. 2007;35:473–485. - PubMed
-
- Rivera A, Fisher SA, Fritsche LG, et al. Hypothetical LOC387715 is a second major susceptibility gene for age-related macular degeneration, contributing independently of complement factor H to disease risk. Hum Mol Genet. 2005;14:3227–3236. - PubMed
Publication types
MeSH terms
Substances
Grants and funding
LinkOut - more resources
Full Text Sources
Miscellaneous

