

Monitoring of urinary L-type fatty acid-binding protein predicts histological severity of acute kidney injury
- PMID: 19264903
- PMCID: PMC2671349
- DOI: 10.2353/ajpath.2009.080644
Monitoring of urinary L-type fatty acid-binding protein predicts histological severity of acute kidney injury
Abstract
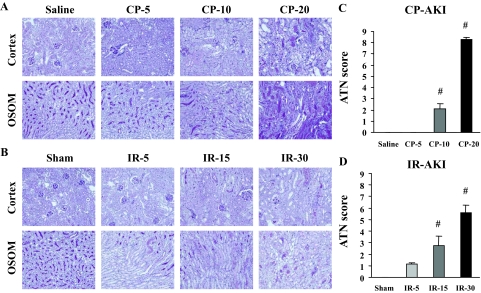
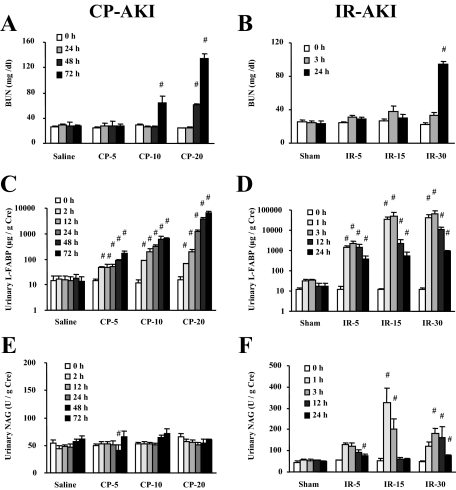
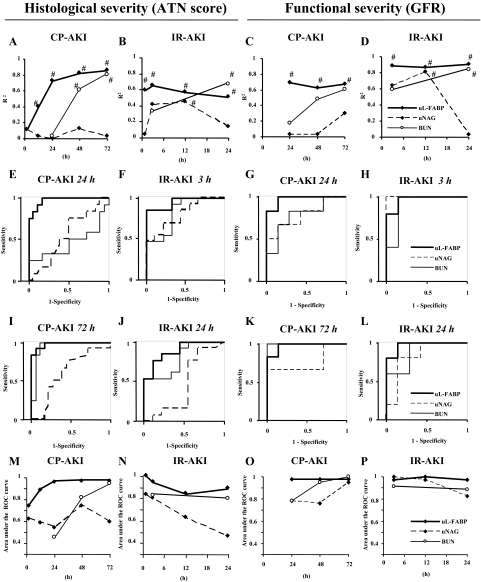
The present study aimed to evaluate whether levels of urinary L-type fatty acid-binding protein (L-FABP) could be used to monitor histological injury in acute kidney injury (AKI) induced by cis-platinum (CP) injection and ischemia reperfusion (IR). Different degrees of AKI severity were induced by several renal insults (CP dose and ischemia time) in human L-FABP transgenic mice. Renal histological injury scores increased with both CP dose and ischemic time. In CP-induced AKI, urinary L-FABP levels increased exponentially even in the lowest dose group as early as 2 hours, whereas blood urea nitrogen (BUN) levels increased at 48 hours. In IR-induced AKI, BUN levels increased only in the 30-minute ischemia group 24 hours after reperfusion; however, urinary L-FABP levels increased more than 100-fold, even in the 5-minute ischemia group after 1 hour. In both AKI models, urinary L-FABP levels showed a better correlation with final histological injury scores and glomerular filtration rates measured by fluorescein isothiocyanate-labeled inulin injection than with levels of BUN and urinary N-acetyl-D-glucosaminidase, especially at earlier time points. Receiver operating characteristic curve analysis demonstrated that urinary L-FABP was superior to other biomarkers for the detection of significant histological injuries and functional declines. In conclusion, urinary L-FABP levels are better suited to allow the accurate and earlier detection of both histological and functional insults in ischemic and nephrotoxin-induced AKI compared with conventional renal markers.
Figures
Similar articles
-
Combination of two urinary biomarkers predicts acute kidney injury after adult cardiac surgery.Ann Thorac Surg. 2012 Feb;93(2):577-83. doi: 10.1016/j.athoracsur.2011.10.048. Ann Thorac Surg. 2012. PMID: 22269724 Clinical Trial.
-
Urinary L-type fatty acid-binding protein can reflect renal tubulointerstitial injury.Am J Pathol. 2009 Apr;174(4):1203-11. doi: 10.2353/ajpath.2009.080511. Epub 2009 Mar 5. Am J Pathol. 2009. PMID: 19264908 Free PMC article.
-
Utility of urinary tubular markers for monitoring chronic tubulointerstitial injury after ischemia-reperfusion.Nephrology (Carlton). 2018 Apr;23(4):308-316. doi: 10.1111/nep.12998. Nephrology (Carlton). 2018. PMID: 28063188
-
Urinary L-type fatty acid-binding protein as a new renal biomarker in critical care.Curr Opin Crit Care. 2010 Dec;16(6):545-9. doi: 10.1097/MCC.0b013e32833e2fa4. Curr Opin Crit Care. 2010. PMID: 20736829 Review.
-
[L-type fatty acid binding protein (L-FABP) and kidney disease].Rinsho Byori. 2014 Feb;62(2):163-70. Rinsho Byori. 2014. PMID: 24800492 Review. Japanese.
Cited by
-
L-FABP can be an early marker of acute kidney injury in children.Pediatr Nephrol. 2013 Jun;28(6):963-9. doi: 10.1007/s00467-013-2421-z. Epub 2013 Feb 14. Pediatr Nephrol. 2013. PMID: 23407997
-
Performance of urinary liver-type fatty acid-binding protein in acute kidney injury: a meta-analysis.Am J Kidney Dis. 2013 Mar;61(3):430-9. doi: 10.1053/j.ajkd.2012.10.016. Epub 2012 Dec 8. Am J Kidney Dis. 2013. PMID: 23228945 Free PMC article.
-
New biomarkers for the quick detection of acute kidney injury.ISRN Nephrol. 2012 Nov 1;2013:394582. doi: 10.5402/2013/394582. eCollection 2013. ISRN Nephrol. 2012. PMID: 24967225 Free PMC article. Review.
-
Time Course of Kidney Injury Biomarkers in Children With Septic Shock: Nested Cohort Study Within the Pragmatic Pediatric Trial of Balanced Versus Normal Saline Fluid in Sepsis Trial.Pediatr Crit Care Med. 2025 Jun 1;26(6):e816-e826. doi: 10.1097/PCC.0000000000003737. Epub 2025 Apr 2. Pediatr Crit Care Med. 2025. PMID: 40172287 Clinical Trial.
-
TEMPOL has limited protective effects on renal oxygenation and hemodynamics but reduces kidney damage and inflammation in a rat model of renal ischemia/reperfusion by aortic clamping.J Clin Transl Res. 2015 Sep 30;1(2):1-13. eCollection 2015 Sep 30. J Clin Transl Res. 2015. PMID: 30873445 Free PMC article.
References
-
- Chertow GM, Burdick E, Honour M, Bonventre JV, Bates DW. Acute kidney injury, mortality, length of stay, and costs in hospitalized patients. J Am Soc Nephrol. 2005;16:3365–3370. - PubMed
-
- Coca SG, Yalavarthy R, Concato J, Parikh CR. Biomarkers for the diagnosis and risk stratification of acute kidney injury: a systematic review. Kidney Int. 2008;73:1008–1016. - PubMed
-
- Yamamoto T, Noiri E, Ono Y, Doi K, Negishi K, Kamijo A, Kimura K, Fujita T, Kinukawa T, Taniguchi H, Nakamura K, Goto M, Shinozaki N, Ohshima S, Sugaya T. Renal L-type fatty acid binding protein in acute ischemic injury. J Am Soc Nephrol. 2007;18:2894–2902. - PubMed
-
- Portilla D, Dent C, Sugaya T, Nagothu KK, Kundi I, Moore P, Noiri E, Devarajan P. Liver fatty acid-binding protein as a biomarker of acute kidney injury after cardiac surgery. Kidney Int. 2008;73:465–472. - PubMed
-
- Pabla N, Dong Z. Cisplatin nephrotoxicity: mechanisms and renoprotective strategies. Kidney Int. 2008;73:994–1007. - PubMed
Publication types
MeSH terms
Substances
Grants and funding
LinkOut - more resources
Full Text Sources
Other Literature Sources
Medical
Molecular Biology Databases
Miscellaneous
