

The histone acetyl transferase activity of monocytic leukemia zinc finger is critical for the proliferation of hematopoietic precursors
- PMID: 19264921
- PMCID: PMC2686138
- DOI: 10.1182/blood-2008-04-152017
The histone acetyl transferase activity of monocytic leukemia zinc finger is critical for the proliferation of hematopoietic precursors
Abstract
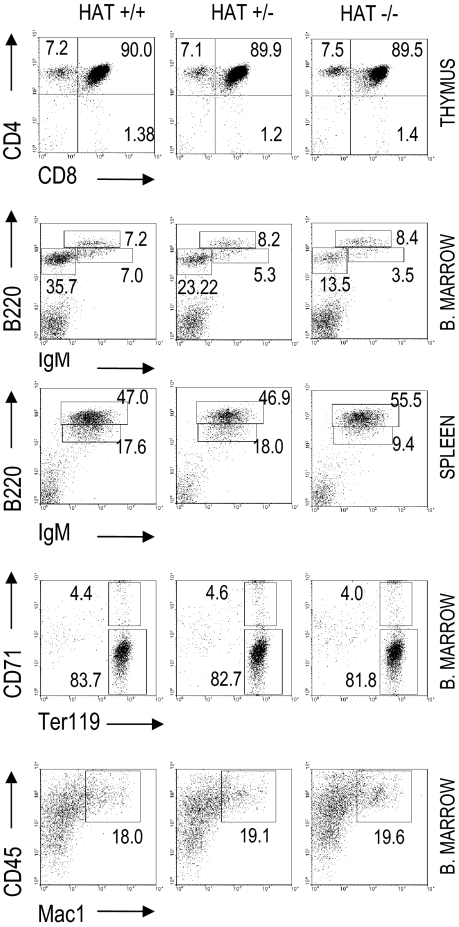
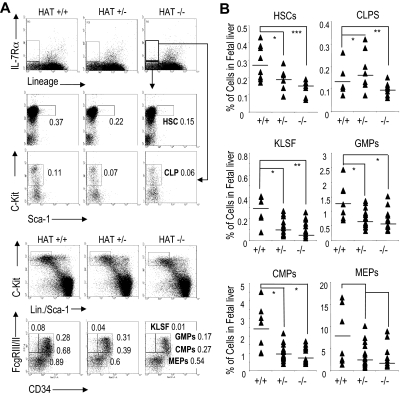
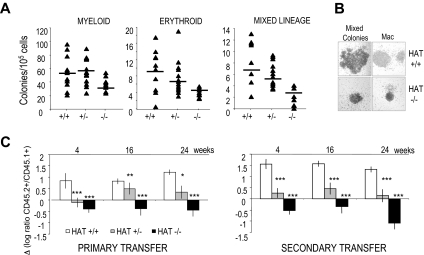
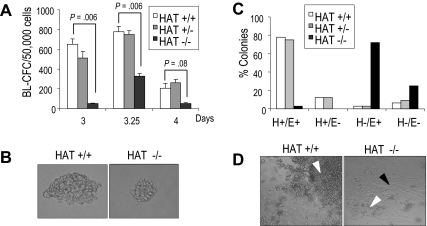
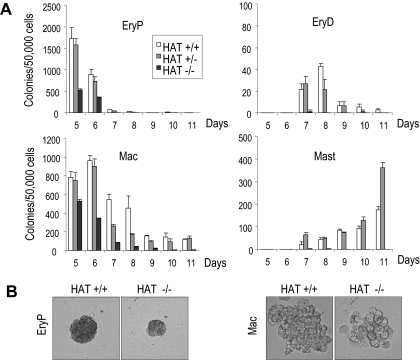
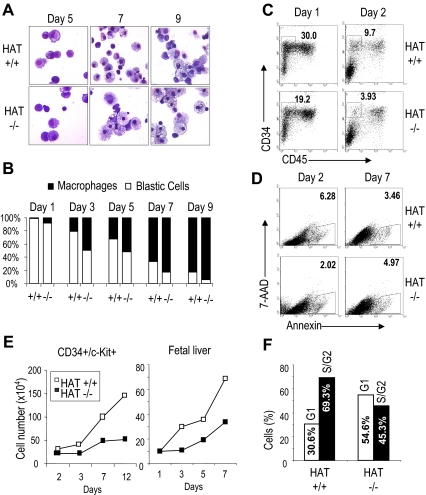
The monocytic leukemia zinc finger (MOZ) gene encodes a large multidomain protein that contains, besides other domains, 2 coactivation domains for the transcription factor Runx1/acute myeloid leukemia 1 and a histone acetyl transferase (HAT) catalytic domain. Recent studies have demonstrated the critical requirement for the complete MOZ protein in hematopoietic stem cell development and maintenance. However, the specific function of the HAT activity of MOZ remains unknown, as it has been shown that MOZ HAT activity is not required either for its role as Runx1 coactivator or for the leukemic transformation induced by MOZ transcriptional intermediary factor 2 (TIF2). To assess the specific requirement for this HAT activity during hematopoietic development, we have generated embryonic stem cells and mouse lines carrying a point mutation that renders the protein catalytically inactive. We report in this study that mice exclusively lacking the HAT activity of MOZ exhibit significant defects in the number of hematopoietic stem cells and hematopoietic committed precursors as well as a defect in B-cell development. Furthermore, we demonstrate that the failure to maintain a normal number of hematopoietic precursors is caused by the inability of HAT(-/-) cells to expand. These results indicate a specific role of MOZ-driven acetylation in controlling a desirable balance between proliferation and differentiation during hematopoiesis.
Figures
Similar articles
-
MOZ is essential for maintenance of hematopoietic stem cells.Genes Dev. 2006 May 15;20(10):1321-30. doi: 10.1101/gad.1393106. Genes Dev. 2006. PMID: 16702405 Free PMC article.
-
Monocytic leukemia zinc finger protein is essential for the development of long-term reconstituting hematopoietic stem cells.Genes Dev. 2006 May 1;20(9):1175-86. doi: 10.1101/gad.1382606. Genes Dev. 2006. PMID: 16651658 Free PMC article.
-
Roles of the histone acetyltransferase monocytic leukemia zinc finger protein in normal and malignant hematopoiesis.Cancer Sci. 2008 Aug;99(8):1523-7. doi: 10.1111/j.1349-7006.2008.00865.x. Cancer Sci. 2008. PMID: 18754862 Free PMC article. Review.
-
The MYSTerious MOZ, a histone acetyltransferase with a key role in haematopoiesis.Immunology. 2013 Jun;139(2):161-5. doi: 10.1111/imm.12072. Immunology. 2013. PMID: 23347099 Free PMC article. Review.
-
The human monocytic leukemia zinc finger histone acetyltransferase domain contains DNA-binding activity implicated in chromatin targeting.J Biol Chem. 2007 Dec 14;282(50):36603-13. doi: 10.1074/jbc.M705812200. Epub 2007 Oct 9. J Biol Chem. 2007. PMID: 17925393
Cited by
-
MOZ regulates B-cell progenitors and, consequently, Moz haploinsufficiency dramatically retards MYC-induced lymphoma development.Blood. 2015 Mar 19;125(12):1910-21. doi: 10.1182/blood-2014-08-594655. Epub 2015 Jan 20. Blood. 2015. PMID: 25605372 Free PMC article.
-
Histone acetyltransferases and histone deacetylases in B- and T-cell development, physiology and malignancy.Genes Cancer. 2015 May;6(5-6):184-213. doi: 10.18632/genesandcancer.65. Genes Cancer. 2015. PMID: 26124919 Free PMC article. Review.
-
The chromatin regulator Brpf1 regulates embryo development and cell proliferation.J Biol Chem. 2015 May 1;290(18):11349-64. doi: 10.1074/jbc.M115.643189. Epub 2015 Mar 15. J Biol Chem. 2015. PMID: 25773539 Free PMC article.
-
Pantothenate and L-Carnitine Supplementation Improves Pathological Alterations in Cellular Models of KAT6A Syndrome.Genes (Basel). 2022 Dec 6;13(12):2300. doi: 10.3390/genes13122300. Genes (Basel). 2022. PMID: 36553567 Free PMC article.
-
Emerging Role of Histone Acetyltransferase in Stem Cells and Cancer.Stem Cells Int. 2018 Dec 16;2018:8908751. doi: 10.1155/2018/8908751. eCollection 2018. Stem Cells Int. 2018. PMID: 30651738 Free PMC article. Review.
References
-
- Rice KL, Hormaeche I, Licht JD. Epigenetic regulation of normal and malignant hematopoiesis. Oncogene. 2007;26:6697–6714. - PubMed
-
- Kioussis D, Georgopoulos K. Epigenetic flexibility underlying lineage choices in the adaptive immune system. Science. 2007;317:620–622. - PubMed
-
- Allis CD, Berger SL, Cote J, et al. New nomenclature for chromatin-modifying enzymes. Cell. 2007;131:633–636. - PubMed
-
- Borrow J, Stanton VP, Jr, Andresen JM, et al. The translocation t(8;16)(p11;p13) of acute myeloid leukaemia fuses a putative acetyltransferase to the CREB-binding protein. Nat Genet. 1996;14:33–41. - PubMed
-
- Kitabayashi I, Aikawa Y, Yokoyama A, et al. Fusion of MOZ and p300 histone acetyltransferases in acute monocytic leukemia with a t(8;22)(p11;q13) chromosome translocation. Leukemia. 2001;15:89–94. - PubMed
Publication types
MeSH terms
Substances
Grants and funding
LinkOut - more resources
Full Text Sources
Medical
Molecular Biology Databases
