. 2009 Apr 24;104(8):952-60.
doi: 10.1161/CIRCRESAHA.108.189803. Epub 2009 Mar 5.

Vascular lipid accumulation, lipoprotein oxidation, and macrophage lipid uptake in hypercholesterolemic zebrafish

Affiliations

Vascular lipid accumulation, lipoprotein oxidation, and macrophage lipid uptake in hypercholesterolemic zebrafish

Konstantin Stoletov et al. Circ Res. .

Abstract

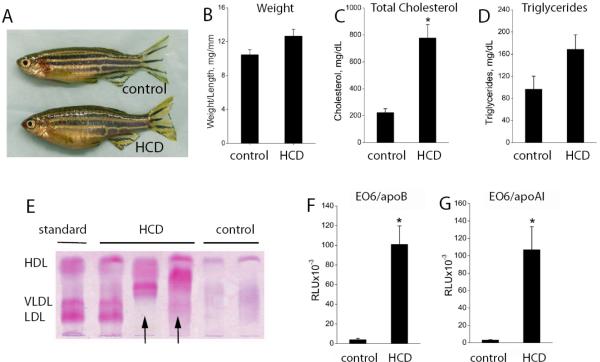
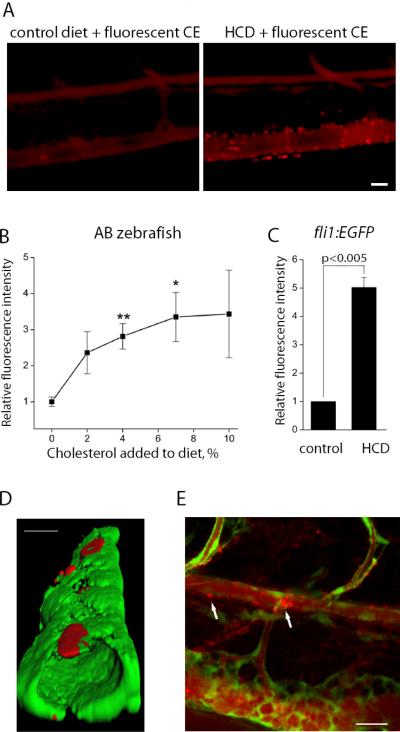
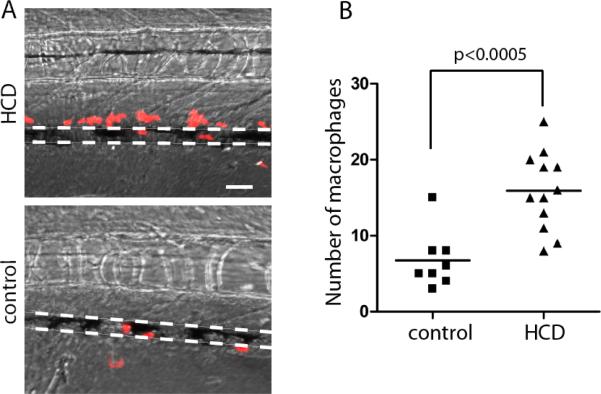
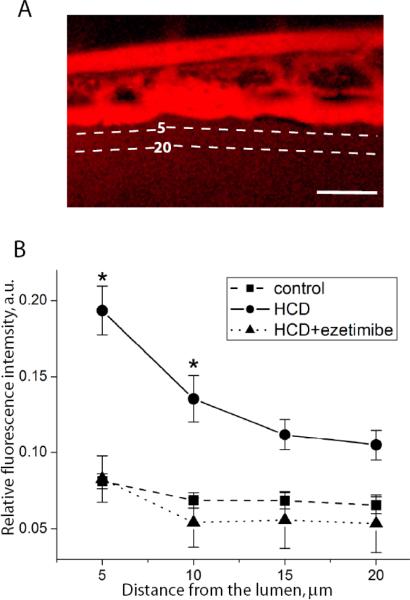
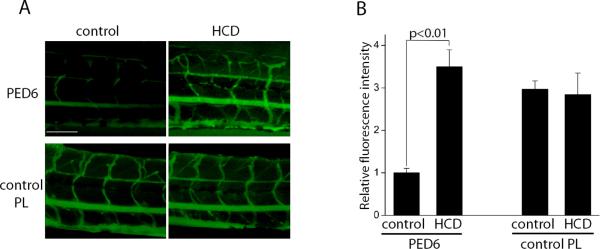
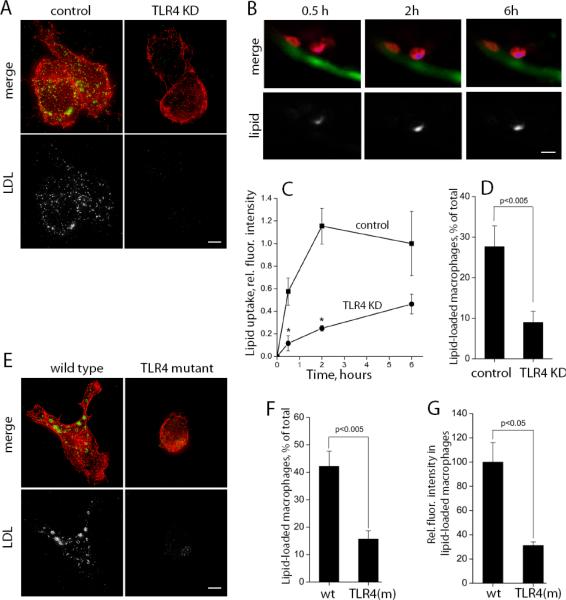
Lipid accumulation in arteries induces vascular inflammation and atherosclerosis, the major cause of heart attack and stroke in humans. Extreme hyperlipidemia induced in mice and rabbits enables modeling many aspects of human atherosclerosis, but microscopic examination of plaques is possible only postmortem. Here we report that feeding adult zebrafish (Danio rerio) a high-cholesterol diet (HCD) resulted in hypercholesterolemia, remarkable lipoprotein oxidation, and fatty streak formation in the arteries. Feeding an HCD supplemented with a fluorescent cholesteryl ester to optically transparent fli1:EGFP zebrafish larvae in which endothelial cells express green fluorescent protein (GFP), and using confocal microscopy enabled monitoring vascular lipid accumulation and the endothelial cell layer disorganization and thickening in a live animal. The HCD feeding also increased leakage of a fluorescent dextran from the blood vessels. Administering ezetimibe significantly diminished the HCD-induced endothelial cell layer thickening and improved its barrier function. Feeding HCD to lyz:DsRed2 larvae in which macrophages and granulocytes express DsRed resulted in the accumulation of fluorescent myeloid cells in the vascular wall. Using a fluorogenic substrate for phospholipase A(2) (PLA(2)), we observed an increased vascular PLA(2) activity in live HCD-fed larvae compared to control larvae. Furthermore, by transplanting genetically modified murine cells into HCD-fed larvae, we demonstrated that toll-like receptor-4 was required for efficient in vivo lipid uptake by macrophages. These results suggest that the novel zebrafish model is suitable for studying temporal characteristics of certain inflammatory processes of early atherogenesis and the in vivo function of vascular cells.


Figures

Figure 1
Figure 1. Hypercholesterolemia and oxidized plasma lipoproteins in adult zebrafish
Five week old zebrafish (both male and female) were fed a 4% cholesterol-enriched (HCD) or normal (control) diet, for 8–12 weeks. A, Female fish (confirmed by dissection) fed a control diet or HCD. B, The ratio of body weight to length (body mass index) (n=17 in each group, both males and females; no statistically significant differences). C and D, Total cholesterol (TC) and triglycerides (TG) in plasma of 3 month old zebrafish (n=11 in each group, both males and females). *, p<0.001. E, Native agarose gel electrophoresis of HCD and control zebrafish plasma, stained with Fat Red. “Standard” is a human plasma (36.4% alpha- (HDL), 18.4% pre-beta- (VLDL) and 45.1% beta-lipoproteins (LDL)). Each “HCD” or “control” lane shows an individual zebrafish plasma sample, representative of total 35 samples. Arrows point at high-mobility bands. F and G, The EO6 immunoassay was performed with 1:200 diluted zebrafish plasma captured on a microtiter plate coated with either anti-human apoB (F) or anti-human apoAI (G) antibody. Oxidation-specific epitopes were detected with EO6 antibody (n=8). *, p<0.05.
Figure 2
Figure 2. Fatty streaks in the dorsal aorta of adult zebrafish
A, Dorsal aorta (DA) and caudal vein (CV) of HCD-fed zebrafish; ISA, inter-segmental artery bifurcation from the DA; mln, melanocytes accumulate around zebrafish blood vessels. B and C, Dorsal aortas of HCD-fed (B) and control (C) zebrafish; van Gieson staining. D and E, Dorsal aorta of HCD-fed zebrafish stained with LipidTOX Red (neutral lipid; merged fluorescent and bright field images)(D) and an antibody against L-plastin (macrophages) counterstained with DAPI (nuclei)(E). Scale, 20 μm (A–D), 5 μm (E).
Figure 3
Figure 3. Lipid accumulation in zebrafish larvae
A, Five-day old zebrafish larvae were fed for 10 days a control diet or an HCD enriched with 4% cholesterol, both supplemented with 10 μg/g of red fluorescent lipid. Images of the caudal vasculature in live larvae show diffuse red fluorescence of circulating fluorescent lipid in both control and HCD-fed larvae, and bright fluorescent lipid deposits in the blood vessel wall only in HCD-fed larvae. Scale, 20 μm. B, AB larvae were fed diets supplemented with 10 μg/g of red fluorescent lipid and zero, 2, 4, 7 or 10% cholesterol for 10 days. Fluorescence intensities of red lipid in the areas shown in panel A were quantified (n=4 animals in each group). C, fli1:EGFP larvae were fed fluorescent lipid-supplemented control or 4% cholesterol diets, and fluorescence intensities of red lipid in the areas shown in panel A were quantified (n=4). D, 3D reconstruction of the caudal vein in a live fli1:EGFP zebrafish, fed HCD diet, showing green fluorescence from EC and red fluorescence from the deposits of the lipid-associated BODIPY 576/589 fluorophore, localizing beneath EC. Scale, 25 μm. E, Fluorescent lipid accumulation in the dorsal aorta. Note the larger lipid deposit at the bifurcation site. Scale, 20 μm.
Figure 4
Figure 4. HCD-induced myeloid cell recruitment to the vasculature
Five-day old lyz:DsRed2 larvae were fed HCD (n=12) or control diet (n=8) for 10 days, and red fluorescent cells accumulated within 50 μm of the caudal vein (delineated by dotted lines) were counted. Merge of fluorescent and bright field images. Scale, 50 μm.
Figure 5
Figure 5. HCD-induced endothelial layer disorganization and thickening
Experimental conditions as in Fig. 3C. A, 3D reconstruction (inner vascular surface) of the caudal vein in control and HCD-fed fli1:EGFP zebrafish. Green fluorescence is from EC. B, fli1:EGFP larvae were fed control or HC diets; one group of HCD-fed larvae was exposed to 40 μg/ml ezetimibe added into the fish tank water during the feeding period. Upper panels show lipid accumulation (red fluorescence) in the intestine and the peritoneum. Lower panels show EC morphology (green fluorescence) in peripheral vasculature. Scale, 20 μm. C, An apparent thickness of the EC layer in the caudal vein was calculated from 3D digital reconstructions of 640 μm long segments of the caudal vein, as described in Methods (n=5–7 animals per group).
Figure 6
Figure 6. HCD-induced increase in endothelial layer permeability
Experimental conditions as in Fig. 5B, but no fluorescent lipid was added to the diet. Leakage of i.v. injected red fluorescent dextran (2×10⁶Da) from the caudal vein was measured as described in Methods. Dashed lines at 5 and 20 μm from the lumen show where the fluorescence intensities were measured. Scale, 50 μm. *, p<0.01 (n=9–11 animals per group).
Figure 7
Figure 7. HCD-induced PLA2 activity
A, AB larvae were fed a control diet or HCD for 10 days, then placed in a 1 μg/ml solution of PED6, a fluorogenic PLA2 substrate, for 2 hours. Green fluorescence (hydrolyzed PED6) indicates the PLA2 activity. In a separate set of experiments, PED6 was replaced with BODIPY®-FLC5-HPC (0.67 μg/ml), a control fluorescent phospholipid whose fluorescence is independent of PLA2 cleavage. Scale, 100 μm. B, Quantification of the data presented in panel A (n=4).
Figure 8
Figure 8. TLR4-dependent lipid uptake
A, In a cell culture experiment, the uptake of Alexa Fluor 488-labeled native LDL (150 μg/ml) was stimulated by non-labeled mmLDL (50 μg/ml) for 1 hour. J774 macrophages were expressing scrambled shRNA (control) or TLR4-specific shRNA (TLR4 KD). Red, F-actin; green, Alexa488-LDL. The fluorescence from labeled LDL is shown in white in lower panels. Scale, 5 μm. B, CellTracker Orange-labeled control J774 macrophages were transplanted into fli1:EGFP larvae that, prior to the transplantation, was fed for 10 days a HCD supplemented with red fluorescent lipid. Repetitive images of the same cells in live fish were captured (red, macrophages; blue and white, fluorescent lipid; green, EC). Scale, 10 μm. C, From the data collected in experiments in panel B, the time courses of lipid uptake by individual transplanted macrophages were measured for control and TLR4 KD J774 cells (n=25–30 cells for each time point; total of 10 animals imaged). *, p<0.01. D, In a separate set of experiments, the percentage of transplanted macrophages that accumulated fluorescent lipid 24 hours post injection into HCD-fed larvae was determined (n=9). E, In a cell culture experiment, the uptake of Alexa Fluor 488-labeled native LDL (150 μg/ml) was stimulated by non-labeled mmLDL (50 μg/ml) for 1 hour in wild type and TLR4-mutant primary macrophages harvested from C3H mice. Red, F-actin; green and white, Alexa488-LDL. Scale, 5 μm. F, In a zebrafish transplant experiment, performed as in panel B, a percentage of transplanted primary macrophages that accumulated lipid 2 hours post injection into HCD-fed larvae was determined for wild type and TLR4-mutant primary macrophages (n=5 animals per group; total of 234 wild type and 125 TLR4-mutant cells were counted). G, Integrated intensities of intracellular fluorescent lipid in only those transplanted primary macrophages that were counted in panel F (n=26 for wild type and n=11 for TLR4-mutant cells; not all positive cells were suitable for quantification due to their position or image quality).

References

    1. Lawson ND, Weinstein BM. In Vivo Imaging of Embryonic Vascular Development Using Transgenic Zebrafish. Developmental Biology. 2002;248:307–318. - PubMed
    1. Stoletov K, Montel V, Lester RD, Gonias SL, Klemke R. High-resolution imaging of the dynamic tumor cell vascular interface in transparent zebrafish. PNAS. 2007;104:17406–17411. - PMC - PubMed
    1. Babin PJ, Vernier JM. Plasma lipoproteins in fish. J Lipid Res. 1989;30:467–489. - PubMed
    1. Vastesaeger MM, Delcourt R. The Natural History of Atherosclerosis. Circulation. 1962;26:841–855. - PubMed
    1. Seierstad SL, Poppe TT, Koppang EO, Svindland A, Rosenlund G, Froyland L, Larsen S. Influence of dietary lipid composition on cardiac pathology in farmed Atlantic salmon, Salmo salar L. Journal of Fish Diseases. 2005;28:677–690. - PubMed

Publication types

MeSH terms