. 2009 Mar 15;182(6):3461-8.
doi: 10.4049/jimmunol.0802535.

A central role for induced regulatory T cells in tolerance induction in experimental colitis

Affiliations

A central role for induced regulatory T cells in tolerance induction in experimental colitis

Dipica Haribhai et al. J Immunol. .

Abstract

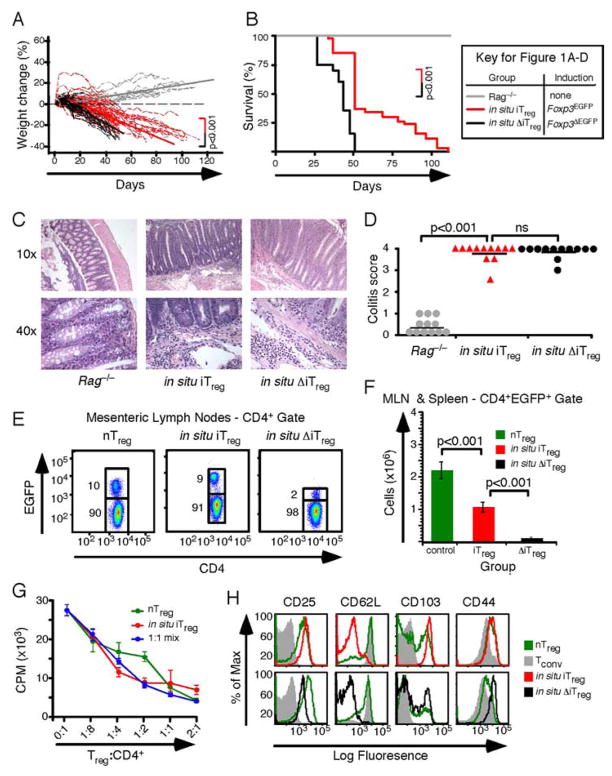
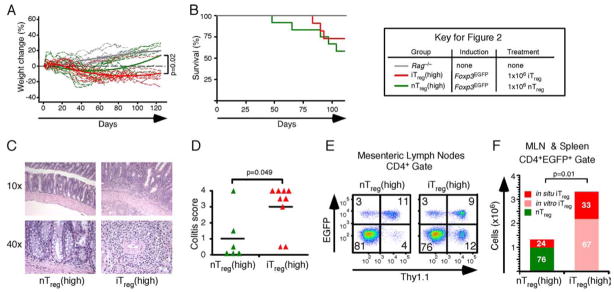
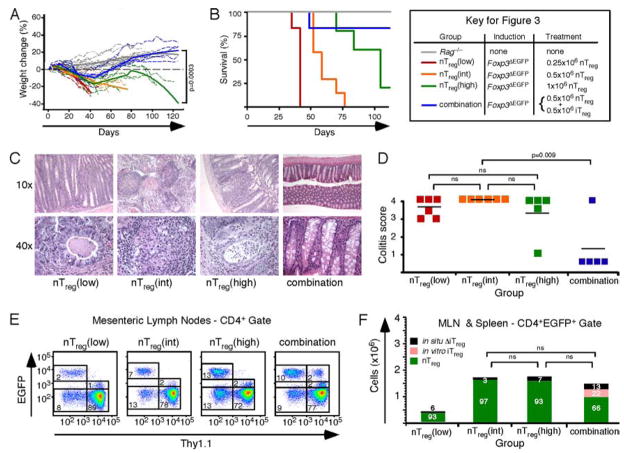
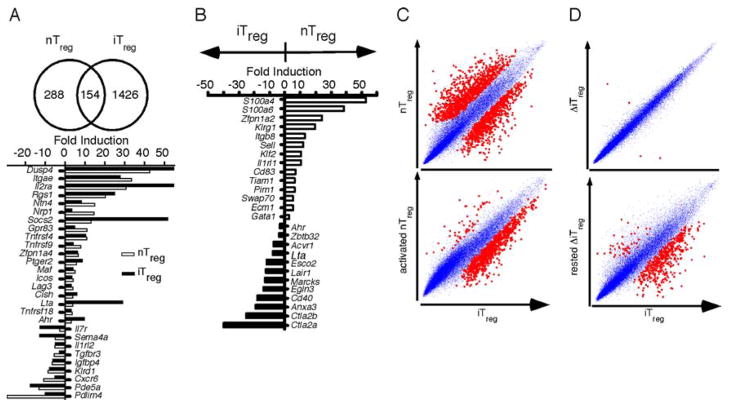
In addition to thymus-derived or natural T regulatory (nT(reg)) cells, a second subset of induced T regulatory (iT(reg)) cells arises de novo from conventional CD4(+) T cells in the periphery. The function of iT(reg) cells in tolerance was examined in a CD45RB(high)CD4(+) T cell transfer model of colitis. In situ-generated iT(reg) cells were similar to nT(reg) cells in their capacity to suppress T cell proliferation in vitro and their absence in vivo accelerated bowel disease. Treatment with nT(reg) cells resolved the colitis, but only when iT(reg) cells were also present. Although iT(reg) cells required Foxp3 for suppressive activity and phenotypic stability, their gene expression profile was distinct from the established nT(reg) "genetic signature," indicative of developmental and possibly mechanistic differences. These results identified a functional role for iT(reg) cells in vivo and demonstrated that both iT(reg) and nT(reg) cells can act in concert to maintain tolerance.


Figures

FIGURE 1
FIGURE 1
Induction of colitis in the absence of functional Foxp3. A, Weight change following the adoptive transfer of 4 × 10⁵ CD4+EGFPThy1.2+CD45RBhigh T cells isolated from Foxp3EGFP (dashed red lines; n = 47) and Foxp3ΔEGFP (dashed black lines; n = 20) mice into Rag−/− recipients. Control Rag−/− littermates (gray lines; n = 11) did not receive transferred cells. Color-matched linear regression lines are plotted for each data set. B, Kaplan-Meier survival curves for the mice in A. C, Representative histological sections from the colons of randomly selected mice in A stained with H&E. D, Scatter plot showing the colitis score for each mouse where histology was obtained. E, Representative flow cytometry analysis of the mesenteric lymph nodes from each group (n = 7, 14, and 17, left to right). Numbers denote means for the adjacent gate. F, The total number of Treg cells found in the mesenteric lymph nodes of healthy Foxp3EGFP mice (green) and in mice with colitis with either functional (red) or nonfunctional (black) in situ-derived iTreg cells. G, Representative data from in vitro suppression assays (n = 3) using sorted in situ-derived iTreg cells (red), sorted nTreg cells from healthy mice (green), or a 50:50 mix of each population (blue) to inhibit the anti-TCR-induced proliferation of unfractionated splenocytes. The ratio of Treg cells to CD4+ responder splenocytes is indicated. H, Representative cell surface marker analysis of CD4+EGFP+ mesenteric lymph node Treg cells from E above stained as indicated.
FIGURE 2
FIGURE 2
Treatment of colitis in the presence of in situ-derived iTreg cells. A, Weight change following colitis induced by adoptive transfer of 4 × 10⁵ CD4+EGFPThy1.2+CD45RBhigh T cells isolated from Foxp3EGFP mice. After losing 5–7% of their body weight, recipients were treated by i.p. injection of 1 × 10⁶ sorted in vitro-derived Thy1.1+EGFP+ iTreg cells (red; n = 9) or by 1 × 106 sorted Thy1.1+EGFP+ nTreg cells (green; n = 6). Color-matched solid lines represent the polynomial fit based on a random coefficient regression model. B, Kaplan-Meier survival curves for the mice in A. C, Representative histological sections from the colons of the mice in A stained with H&E. D, Scatter plots showing colitis scores for each group. E, Representative flow cytometry analysis of the mesenteric lymph nodes from mice treated with nTreg cells (left panel) or iTreg cells (right panel). Numbers denote mean values for the quadrant. F, Bar graphs depicting the total number of Treg cells found in the mesenteric lymph nodes and spleens of treated mice. The proportion of in situ-derived iTreg cells (red), nTreg cells (green), and in vitro-derived iTreg cells (pink) is indicated.
FIGURE 3
FIGURE 3
Treatment of colitis in the absence of in situ-derived iTreg cells. A, Weight change following colitis induced by adoptive transfer of 4 × 10⁵ CD4+EGFP Thy1.1+CD45RBhigh T cells isolated from Foxp3ΔEGFP mice. After 5–7% weight loss, recipients were treated by i.p. injection of 0.25 × 10⁶ Thy1.2+EGFP+ nTreg cells (red; n = 6), by 0.5 × 10⁶ Thy1.2+EGFP+ nTreg cells (orange; n = 6), by 1 × 10⁶ Thy1.2+EGFP+ nTreg cells (green; n = 5), or by a mixture of 0.5 × 10⁶ Thy1.1+ iTreg and 0.5 × 10⁶ Thy1.2+nTreg cells (blue; n = 5). Color-matched solid lines represent the polynomial fit based on a random coefficient regression model. B, Kaplan-Meier survival curves for the mice in A. C, Representative histological sections from the colons of the mice in A stained with H&E. D, Scatter plots depicting the colitis scores for each group. E, Representative flow cytometry analysis of the mesenteric lymph nodes from mice treated with nTreg cells (left panels) or a mixture of both cell types (right panel). Numbers denote mean values for the quadrant or gate. F, Bar graphs depicting the total number of Treg cells found in the mesenteric lymph nodes and spleens of treated mice. The proportion of nonfunctional in situ-derived ΔiTreg cells (black), nTreg cells (green), and in vitro-derived iTreg cells (pink) is indicated. ns, Not significant).
FIGURE 4
FIGURE 4
Overlap among the gene expression profiles of iTreg cells and nTreg cells. A comparison of the expression profiles of iTreg and nTreg cells with that of Tconv cells identified commonly (A) and selectively (B) expressed genes. All cells were derived from Foxp3EGFP mice. The Venn diagrams illustrate the comparison groups and the number of distinct and shared genes. The bar graphs show a few of the genes that are differentially expressed in iTreg and nTreg cells as mean fold change values derived from three to five independent experiments, each representing mRNA pooled from 4 to 10 mice and scoring p < 0.05 by Student’s unpaired two-tailed t test. C, Scatter plots of mean gene expression values of iTreg cells vs nTreg cells (top panel) or activated nTreg cells (bottom panel). D, Scatter plots of mean gene expression values of iTreg cells vs ΔiTreg cells (top panel) or iTreg cells vs ΔiTreg cells cultured for 7 days in 50 IU/ml IL-2 (bottom panel). Gene comparisons that are found significant in C and D are highlighted in red.

References

    1. Chen W, Jin W, Hardegen N, Lei KJ, Li L, Marinos N, McGrady G, Wahl SM. Conversion of peripheral CD4+CD25− naive T cells to CD4+CD25+ regulatory T cells by TGF-β induction of transcription factor Foxp3. J Exp Med. 2003;198:1875–1886. - PMC - PubMed
    1. Fantini MC, Becker C, Monteleone G, Pallone F, Galle PR, Neurath MF. Cutting edge: TGF-β induces a regulatory phenotype in CD4+CD25− T cells through Foxp3 induction and down-regulation of Smad7. J Immunol. 2004;172:5149–5153. - PubMed
    1. Zheng SG, Wang J, Wang P, Gray JD, Horwitz DA. IL-2 is essential for TGF-β to convert naive CD4+CD25− cells to CD25+Foxp3+ regulatory T cells and for expansion of these cells. J Immunol. 2007;178:2018–2027. - PubMed
    1. Davidson TS, DiPaolo RJ, Andersson J, Shevach EM. Cutting edge: IL-2 is essential for TGF-β-mediated induction of Foxp3+ T regulatory cells. J Immunol. 2007;178:4022–4026. - PubMed
    1. Kulkarni AB, Huh CG, Becker D, Geiser A, Lyght M, Flanders KC, Roberts AB, Sporn MB, Ward JM, Karlsson S. Transforming growth factor β1 null mutation in mice causes excessive inflammatory response and early death. Proc Natl Acad Sci USA. 1993;90:770–774. - PMC - PubMed

Publication types

MeSH terms

Substances