

Chlamydia trachomatis infection modulates trophoblast cytokine/chemokine production
- PMID: 19265152
- PMCID: PMC2652680
- DOI: 10.4049/jimmunol.0800764
Chlamydia trachomatis infection modulates trophoblast cytokine/chemokine production
Abstract
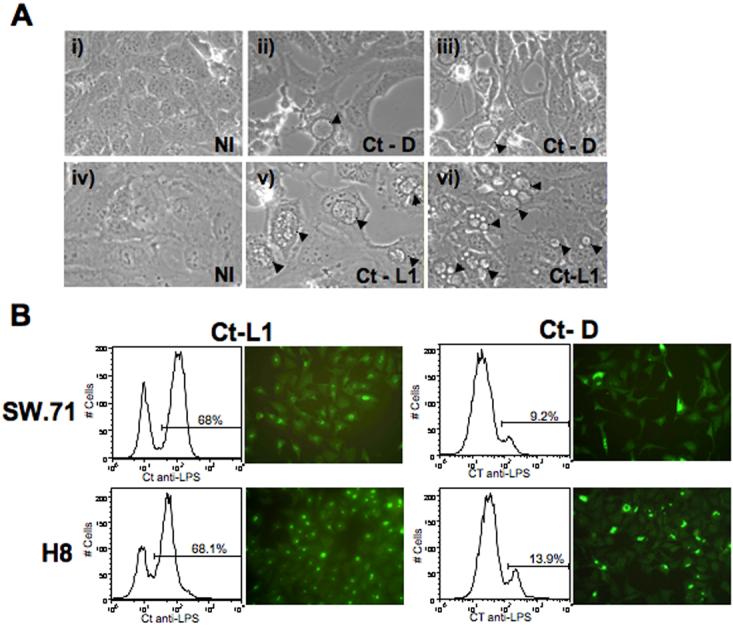
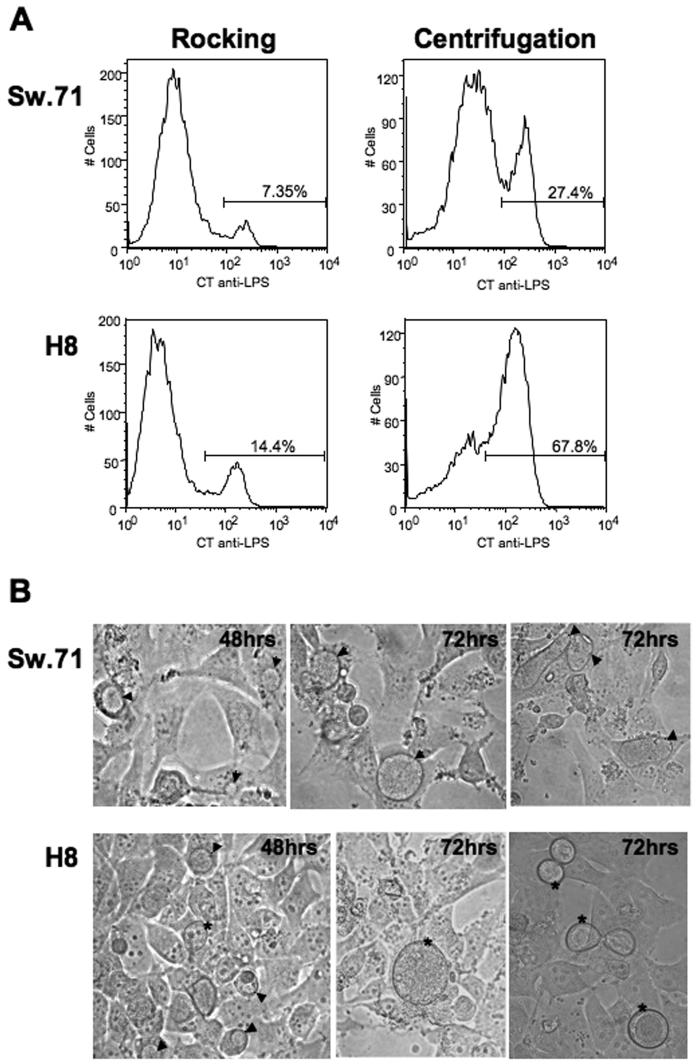
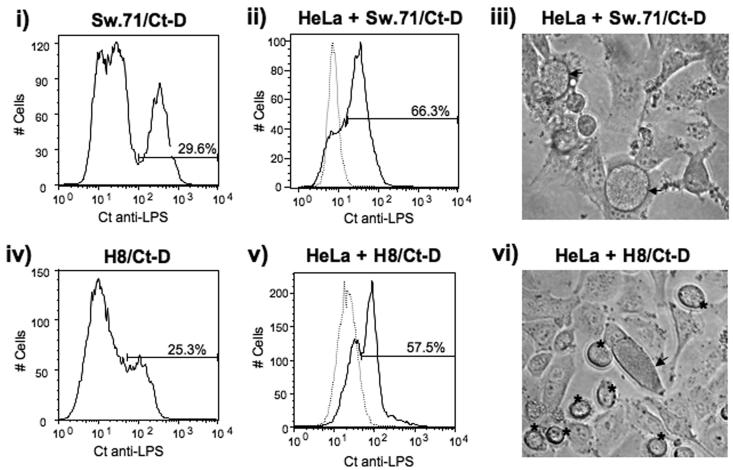
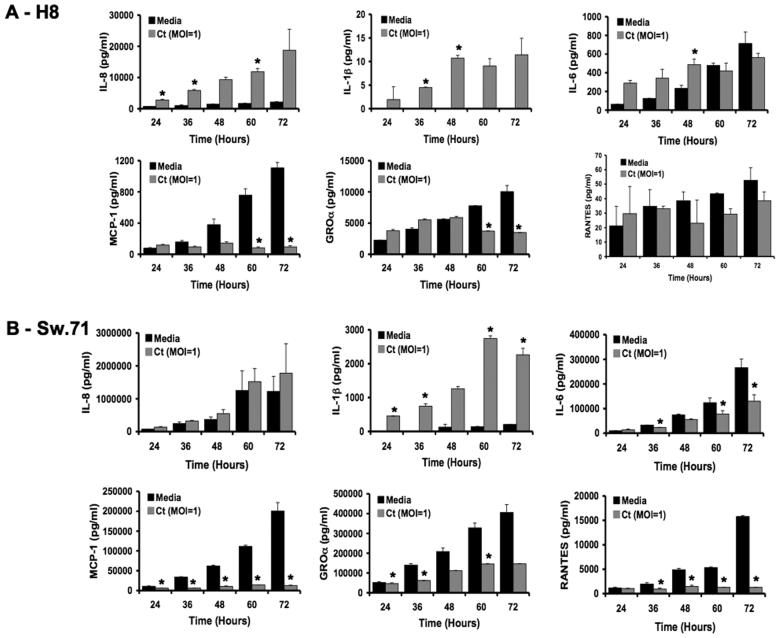
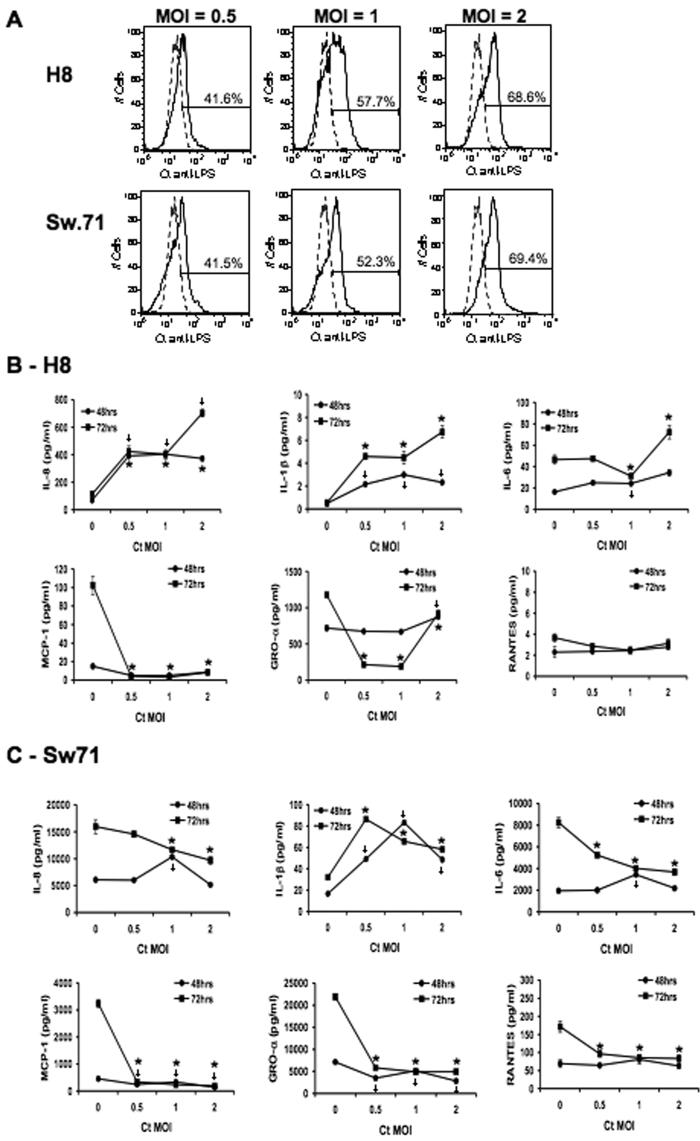
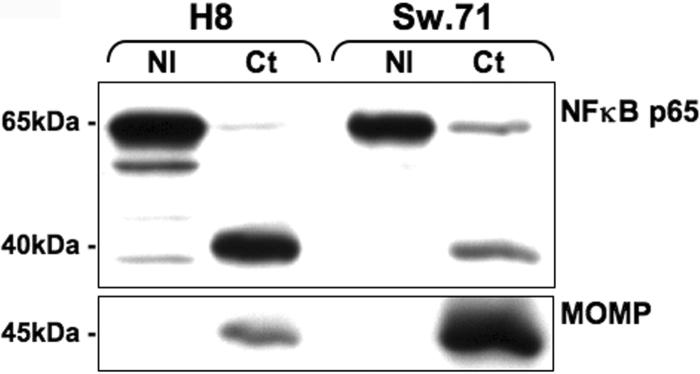
It is well established that intrauterine infections can pose a threat to pregnancy by gaining access to the placenta and fetus, and clinical studies have strongly linked bacterial infections with preterm labor. Although Chlamydia trachomatis (Ct) can infect the placenta and decidua, little is known about its effects on trophoblast cell immune function. We have demonstrated that Ct infects trophoblast cells to form inclusions and completes the life cycle within these cells by generating infectious elementary bodies. Moreover, infection with Ct leads to differential modulation of the trophoblast cell's production of cytokines and chemokines. Using two human first trimester trophoblast cell lines, Sw.71 and H8, the most striking feature we found was that Ct infection results in a strong induction of IL-1beta secretion and a concomitant reduction in MCP-1 (CCL2) production in both cell lines. In addition, we have found that Ct infection of the trophoblast results in the cleavage and degradation of NF-kappaB p65. These findings suggest that the effect of a Chlamydia infection on trophoblast secretion of chemokines and cytokines involves both activation of innate immune receptors expressed by the trophoblast and virulence factors secreted into the trophoblast by the bacteria. Such altered trophoblast innate immune responses may have a profound impact on the microenvironment of the maternal-fetal interface and this could influence pregnancy outcome.
Figures
Similar articles
-
Chlamydia heat shock protein 60 induces trophoblast apoptosis through TLR4.J Immunol. 2006 Jul 15;177(2):1257-63. doi: 10.4049/jimmunol.177.2.1257. J Immunol. 2006. PMID: 16818785
-
Toll-like receptors at the maternal-fetal interface in normal pregnancy and pregnancy complications.Am J Reprod Immunol. 2014 Aug;72(2):192-205. doi: 10.1111/aji.12258. Epub 2014 Apr 23. Am J Reprod Immunol. 2014. PMID: 24754320 Review.
-
TLR6 modulates first trimester trophoblast responses to peptidoglycan.J Immunol. 2008 May 1;180(9):6035-43. doi: 10.4049/jimmunol.180.9.6035. J Immunol. 2008. PMID: 18424724 Free PMC article.
-
Chlamydia trachomatis infection of human trophoblast alters estrogen and progesterone biosynthesis: an insight into role of infection in pregnancy sequelae.Int J Med Sci. 2007 Sep 6;4(4):223-31. doi: 10.7150/ijms.4.223. Int J Med Sci. 2007. PMID: 17848980 Free PMC article.
-
Toll-like receptors and their role in the trophoblast.Placenta. 2005 Aug;26(7):540-7. doi: 10.1016/j.placenta.2004.08.010. Placenta. 2005. PMID: 15993703 Review.
Cited by
-
Waddlia chondrophila induces systemic infection, organ pathology, and elicits Th1-associated humoral immunity in a murine model of genital infection.Front Cell Infect Microbiol. 2015 Nov 4;5:76. doi: 10.3389/fcimb.2015.00076. eCollection 2015. Front Cell Infect Microbiol. 2015. PMID: 26583077 Free PMC article.
-
Associations of Chlamydia trachomatis serology with fertility-related and pregnancy adverse outcomes in women: a systematic review and meta-analysis of observational studies.EBioMedicine. 2023 Aug;94:104696. doi: 10.1016/j.ebiom.2023.104696. Epub 2023 Jul 4. EBioMedicine. 2023. PMID: 37413889 Free PMC article.
-
Chlamydia trachomatis infection results in a modest pro-inflammatory cytokine response and a decrease in T cell chemokine secretion in human polarized endocervical epithelial cells.Cytokine. 2013 Aug;63(2):151-65. doi: 10.1016/j.cyto.2013.04.022. Epub 2013 May 11. Cytokine. 2013. PMID: 23673287 Free PMC article.
-
Nod1, but not the ASC inflammasome, contributes to induction of IL-1β secretion in human trophoblasts after sensing of Chlamydia trachomatis.Mucosal Immunol. 2013 Mar;6(2):235-43. doi: 10.1038/mi.2012.63. Epub 2012 Jul 4. Mucosal Immunol. 2013. PMID: 22763410 Free PMC article.
-
Chlamydia muridarum infection associated host MicroRNAs in the murine genital tract and contribution to generation of host immune response.Am J Reprod Immunol. 2015 Feb;73(2):126-40. doi: 10.1111/aji.12281. Epub 2014 Jun 28. Am J Reprod Immunol. 2015. PMID: 24976530 Free PMC article.
References
-
- Wiesenfeld HC, Hillier SL, Krohn MA, Amortegui AJ, Heine RP, Landers DV, Sweet RL. Lower genital tract infection and endometritis: insight into subclinical pelvic inflammatory disease. Obstet Gynecol. 2002;100:456–463. - PubMed
-
- Hossain A, Arif M, Ramia S, Bakir TF. Chlamydia trachomatis as a cause of abortion. J Hyg Epidemiol Microbiol Immunol. 1990;34:53–55. - PubMed
-
- Jain A, Nag VL, Goel MM, Chandrawati, Chaturvedi UC. Adverse foetal outcome in specific IgM positive Chlamydia trachomatis infection in pregnancy. Indian J Med Res. 1991;94:420–423. - PubMed
Publication types
MeSH terms
Substances
Grants and funding
LinkOut - more resources
Full Text Sources
Medical
Miscellaneous
