. 2009 Apr 1;131(12):4425-33.
doi: 10.1021/ja808604h.

Probing the coupling between proton and electron transfer in photosystem II core complexes containing a 3-fluorotyrosine

Affiliations

Probing the coupling between proton and electron transfer in photosystem II core complexes containing a 3-fluorotyrosine

Fabrice Rappaport et al. J Am Chem Soc. .

Abstract

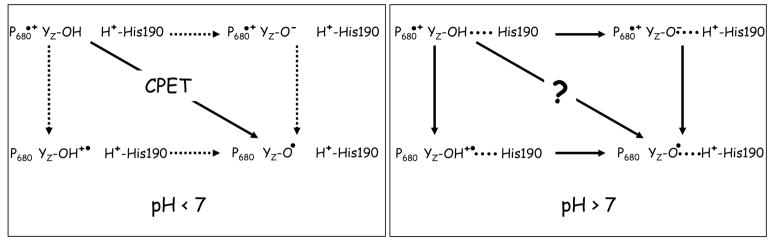
The catalytic cycle of numerous enzymes involves the coupling between proton transfer and electron transfer. Yet, the understanding of this coordinated transfer in biological systems remains limited, likely because its characterization relies on the controlled but experimentally challenging modifications of the free energy changes associated with either the electron or proton transfer. We have performed such a study here in Photosystem II. The driving force for electron transfer from Tyr(Z) to P(680)(*+) has been decreased by approximately 80 meV by mutating the axial ligand of P(680), and that for proton transfer upon oxidation of Tyr(Z) by substituting a 3-fluorotyrosine (3F-Tyr(Z)) for Tyr(Z). In Mn-depleted Photosystem II, the dependence upon pH of the oxidation rates of Tyr(Z) and 3F-Tyr(Z) were found to be similar. However, in the pH range where the phenolic hydroxyl of Tyr(Z) is involved in a H-bond with a proton acceptor, the activation energy of the oxidation of 3F-Tyr(Z) is decreased by 110 meV, a value which correlates with the in vitro finding of a 90 meV stabilization energy to the phenolate form of 3F-Tyr when compared to Tyr (Seyedsayamdost et al. J. Am. Chem. Soc. 2006, 128,1569-1579). Thus, when the phenol of Y(Z) acts as a H-bond donor, its oxidation by P(680)(*+) is controlled by its prior deprotonation. This contrasts with the situation prevailing at lower pH, where the proton acceptor is protonated and therefore unavailable, in which the oxidation-induced proton transfer from the phenolic hydroxyl of Tyr(Z) has been proposed to occur concertedly with the electron transfer to P(680)(*+). This suggests a switch between a concerted proton/electron transfer at pHs < 7.5 to a sequential one at pHs > 7.5 and illustrates the roles of the H-bond and of the likely salt-bridge existing between the phenolate and the nearby proton acceptor in determining the coupling between proton and electron transfer.


Figures

Figure 1
Figure 1
A scheme depicting the reaction pathways for the electron and proton transfer from the phenol group of YZ in Mn-depleted PSII. The left panel illustrates the situation proposed to prevail at low pH, where the nearby proton-accepting base (shown here as being D1-His190, see text for a discussion) is protonated and thus unavailable as a proton acceptor. As discussed in the text, the characteristics of the oxidation rate of YZ are those expected for a concerted electron/proton transfer (CPET). The right panel illustrates the situation thought to prevail above pH ~ 7, where a proton- accepting base in close vicinity to the phenol group of YZ is available. The nature of the coupling between the electron transfer and proton transfer from the phenol group of YZ is the subject of the present study.
Figure 2
Figure 2
Panel A: ESE field-swept difference spectra of labeled PSII core complexes from T. elongatus (black) and Synechocystis sp. PCC 6803 (red) and of unlabeled PSII core complexes from T. elongatus (blue). All spectra have been normalized to an area of one spin. Panel B: A comparison between the first derivative of the ESE field-swept spectrum of labeled PSII core complexes from T. elongatus (black) with the simulated spectrum of 3F-YZ (magenta); shown in green is the spectrum of YZ scaled to account for 25% of the total spin number in the experimental spectrum. The inset compares the difference between the experimental spectrum and the scaled spectrum of YZ (blue) to the simulated spectrum (magenta).
Figure 3
Figure 3
Relative amplitudes of the four exponentials components associated with the reduction of P680•+ as a function of pH. The reduction of P680•+ was measured at 432 nm from 5 ns to 10 ms at various pHs and the kinetics were globally fit with four exponentials (the half-times of which are indicated in the different panels). The solid symbols correspond to the unlabeled PSII from T. elongatus. Fitting these data (solid lines) with the Henderson-Haselbach equation (n=1) yielded pKas of 6.85 ± 0.15 and 6.4 ± 0.2 for the 130 ns and 8 μs components, respectively. The open symbols correspond to the labeled PSII from T. elongatus. Fitting these data (dashed lines) with the Henderson-Haselbach equation (n=1) yielded pKas of 6.9 ± 0.2 and 6.55 ± 0.3 for the 70 ns and 9 μs components, respectively. The solid lines in gray are the fit of the data obtained with labeled PSII normalized to the data obtained with the unlabeled PSII to facilitate the comparison.
Figure 4
Figure 4
Comparison of the reduction kinetics of P680•+ at pH 9.2 in unlabeled (solid symbols) and labeled (open symbols) PSII complexes from T. elongatus (left panel) and Synechocystis sp. PCC 6803 (right panel) at 15°C. The kinetics were normalized to their initial amplitude. The lines show the best fit of the data with four exponentials (the gray and black lines correspond respectively to the labeled and unlabeled PSII complexes). The fit yielded the following time constants for the fast component: T. elongatus: 1.3 107 s−1 ± 1.5 106 (unlabeled), 2.8 107 s−1 ± 2.2 106 (labeled); Synechocystis: 1.9 107 s−1 ± 2.4 106 (unlabeled), 3.7 107 s−1 ± 2.5 106 (labeled), H198A 2.1 107 s−1 ± 3.1 106.
Figure 5
Figure 5
Consequences of the substitution of 3F-YZ for YZ on the dependence upon temperature of the fast component in the reduction of P680•+, at pH 9.2. The left column shows the reduction of P680•+ in the hundreds of ns time range in the unlabeled (panel A) and labeled (panel B) PSII core complexes from T. elongatus. The closed circles and open squares show the kinetics at 25–28°C and 5°C, respectively. The right column shows the reduction of P680•+ in the hundreds of ns time range in the unlabeled (panel C) and labeled (panel D) PSII core complexes from Synechocystis. The closed circles and open squares depict the kinetics at high and low temperature, respectively. Note that the ordinate axis does not go to 0 and that the figure is a focus on the early events. The fit yielded the following time constants for the fast component: T. elongatus: (panel A, unlabeled) 1.75 107 s−1 ± 1.7 106 at 25°C and 1.05 107 s−1 ± 1.8 106 at 5°C; (panel B, labeled) 3.2 107 s−1 ± 4.2 106 at 25°C and 3.1 107 s−1 ± 4.5 106 at 5°C; Synechocystis: (panel C, unlabeled) 3.7 107 s−1 ± 5.7 106 at 28°C and 1.3 107 s−1 ± 5.8 106 at 5°C, (panel D, labeled) 5.2 107 s−1 ± 8.2 106 at 28°C and 3.1 107 s−1 ± 7.5 106 at 5°C.
Figure 6
Figure 6
Consequences of the D1-H198A mutation on the dependence upon temperature of the fast component in the reduction of P680•+, at pH 9.2. The left panel shows the reduction of P680•+ in the hundreds of ns time range in the unlabeled PSII core complexes from Synechocystis WT. The right panel shows the reduction of P680•+ in the hundreds of ns time range in the unlabeled PSII core complexes from Synechocystis D1- H198A mutant. Closed circles, 25°C; Open squares, 5°C. Note that the ordinate axis does not go to 0 and that the figure is a focus on the early events.
Figure 7
Figure 7
Arrhenius plot of the rates of the first (square) and second component (circle) in the reduction of P680•+ at pH 9.2, in unlabeled (solid symbols) and labeled (open symbols) PSII complexes from T. elongatus (left panel) and Synechocystis sp. PCC 6803 (right panel). The data were linearly fitted to extract the activation energy (the results are shown as the solid lines) and the fit yielded the following values: T. elongatus: 120 ± 30 meV (unlabeled PSII), 0 ± 25 meV (labeled PSII); Synechocystis: 220 ± 35 meV (unlabeled PSII) and 110 ± 25 meV (labeled PSII).
Scheme 1
Scheme 1
The stepwise proton transfer/electron transfer pathway.

References

    1. Diner BA, Rappaport F. Annu Rev Plant Biol. 2002;53:551–580. - PubMed
    1. Rappaport F, Diner BA. Coord Chem Rev. 2008;252:259–272.
    1. Dau H, Haumann M. Coord Chem Rev. 2008;252:273–295.
    1. Rappaport F, Guergova-Kuras M, Nixon PJ, Diner BA, Lavergne J. Biochemistry. 2002;41:8518–8527. - PubMed
    1. Cuni A, Xiong L, Sayre RT, Rappaport F, Lavergne J. Phys Chem Chem Phys. 2004;6:4825–4831.

Publication types