

Steady-state kinetic modeling constrains cellular resting states and dynamic behavior
- PMID: 19266013
- PMCID: PMC2637974
- DOI: 10.1371/journal.pcbi.1000298
Steady-state kinetic modeling constrains cellular resting states and dynamic behavior
Abstract
A defining characteristic of living cells is the ability to respond dynamically to external stimuli while maintaining homeostasis under resting conditions. Capturing both of these features in a single kinetic model is difficult because the model must be able to reproduce both behaviors using the same set of molecular components. Here, we show how combining small, well-defined steady-state networks provides an efficient means of constructing large-scale kinetic models that exhibit realistic resting and dynamic behaviors. By requiring each kinetic module to be homeostatic (at steady state under resting conditions), the method proceeds by (i) computing steady-state solutions to a system of ordinary differential equations for each module, (ii) applying principal component analysis to each set of solutions to capture the steady-state solution space of each module network, and (iii) combining optimal search directions from all modules to form a global steady-state space that is searched for accurate simulation of the time-dependent behavior of the whole system upon perturbation. Importantly, this stepwise approach retains the nonlinear rate expressions that govern each reaction in the system and enforces constraints on the range of allowable concentration states for the full-scale model. These constraints not only reduce the computational cost of fitting experimental time-series data but can also provide insight into limitations on system concentrations and architecture. To demonstrate application of the method, we show how small kinetic perturbations in a modular model of platelet P2Y(1) signaling can cause widespread compensatory effects on cellular resting states.
Conflict of interest statement
The authors have declared that no competing interests exist.
Figures
 and
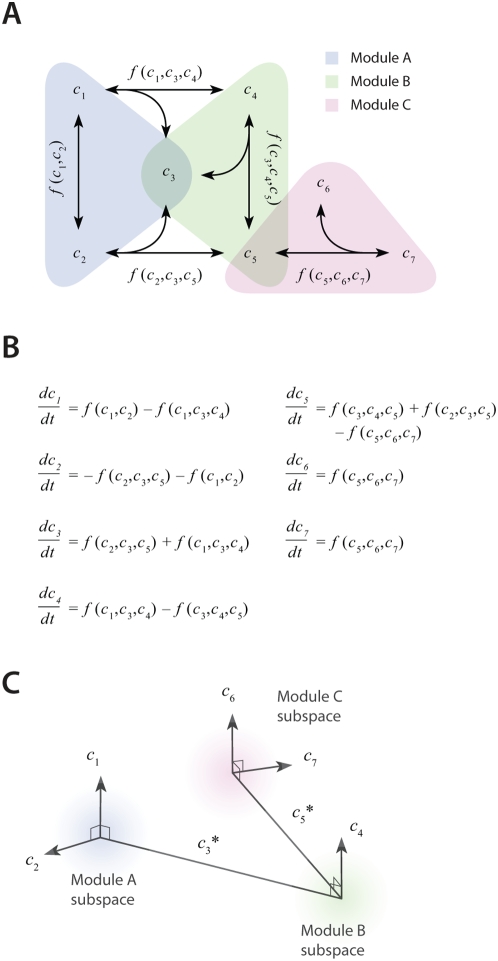
and  each occurring in two modules. Corresponding (B) ODEs and (C) concentration space for the example topology in panel A. Each of the 7 molecules occupies a separate linear dimension, with each module comprising a subspace of the full 7-dimensional space. Modules that share a common molecule have intersecting subspaces.
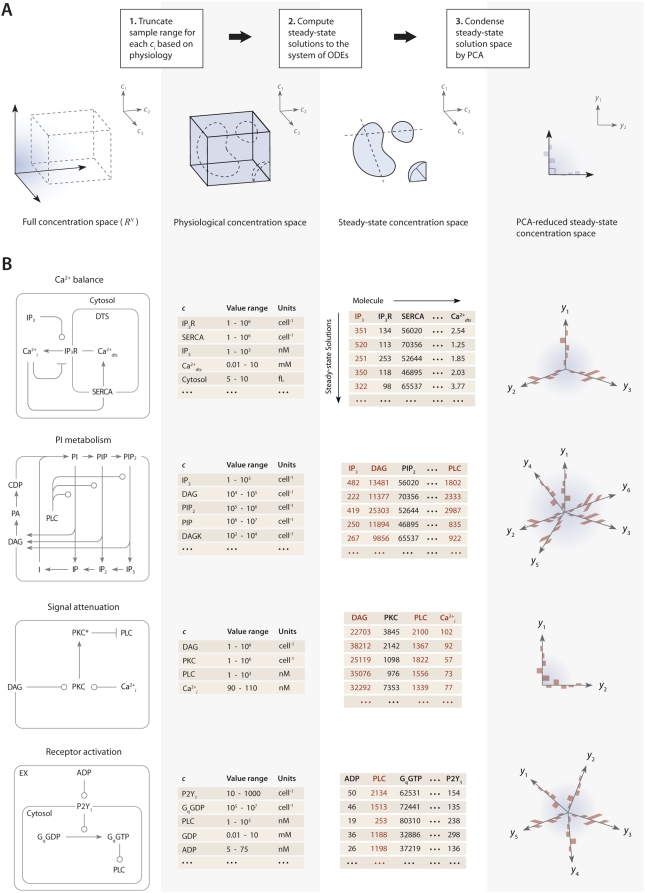
 ) using 109 initial guesses for
  . Specific concentrations within these steady-state solutions were compared to experimentally measured values, and solutions with low error (±10% of known concentration values) for these elements were selected as “points” in the steady-state concentration space. PCA was then applied to transform these points to a new coordinate set that maximally covers the space of steady-state solutions.
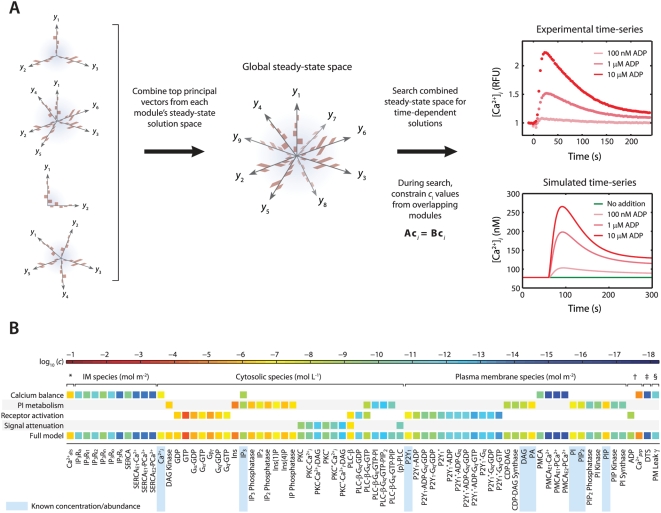
 to ensure that steady-state solutions are consistent. (B) To assemble the platelet signaling model, a set of 16 PC vectors representing all 72 unknown variables in the model were used as search directions in a global optimization routine. The global solution space was searched for models with accurate dynamic behavior using experimental time-series data for ADP-stimulated Ca2+ release. Species are grouped according to compartment. Color values correspond to molar concentrations (mol/L or mol/m2) or as indicated: *DTS species (mol L−1). †Extracellular species (mol L−1). ‡DTS volume (L). §PM leak conductance/area (S m−2).
Similar articles
-
Reducing the allowable kinetic space by constructing ensemble of dynamic models with the same steady-state flux.Metab Eng. 2011 Jan;13(1):60-75. doi: 10.1016/j.ymben.2010.11.001. Epub 2010 Nov 12. Metab Eng. 2011. PMID: 21075211
-
Dynamic simulation of regulatory networks using SQUAD.BMC Bioinformatics. 2007 Nov 26;8:462. doi: 10.1186/1471-2105-8-462. BMC Bioinformatics. 2007. PMID: 18039375 Free PMC article.
-
A two-dimensional mathematical model of non-linear dual-sorption of percutaneous drug absorption.Biomed Eng Online. 2005 Jul 3;4:40. doi: 10.1186/1475-925X-4-40. Biomed Eng Online. 2005. PMID: 15992411 Free PMC article.
-
Fitting enzyme kinetic data with KinTek Global Kinetic Explorer.Methods Enzymol. 2009;467:601-626. doi: 10.1016/S0076-6879(09)67023-3. Methods Enzymol. 2009. PMID: 19897109 Review.
-
Dynamic metabolic flux analysis--tools for probing transient states of metabolic networks.Curr Opin Biotechnol. 2013 Dec;24(6):973-8. doi: 10.1016/j.copbio.2013.03.018. Epub 2013 Apr 20. Curr Opin Biotechnol. 2013. PMID: 23611566 Review.
Cited by
-
Systems modeling of Ca(2+) homeostasis and mobilization in platelets mediated by IP3 and store-operated Ca(2+) entry.Biophys J. 2014 May 6;106(9):2049-60. doi: 10.1016/j.bpj.2014.03.028. Biophys J. 2014. PMID: 24806937 Free PMC article.
-
Systems Analysis of Thrombus Formation.Circ Res. 2016 Apr 29;118(9):1348-62. doi: 10.1161/CIRCRESAHA.115.306824. Circ Res. 2016. PMID: 27126646 Free PMC article. Review.
-
Systems biology of coagulation.J Thromb Haemost. 2013 Jun;11 Suppl 1(0 1):224-32. doi: 10.1111/jth.12220. J Thromb Haemost. 2013. PMID: 23809126 Free PMC article. Review.
-
Modeling and analysis of the molecular basis of pain in sensory neurons.PLoS One. 2009 Sep 11;4(9):e6758. doi: 10.1371/journal.pone.0006758. PLoS One. 2009. PMID: 19750220 Free PMC article.
-
Characterizing the relationship between steady state and response using analytical expressions for the steady states of mass action models.PLoS Comput Biol. 2013;9(2):e1002901. doi: 10.1371/journal.pcbi.1002901. Epub 2013 Feb 28. PLoS Comput Biol. 2013. PMID: 23509437 Free PMC article.
References
-
- Andrews SS, Arkin AP. Simulating cell biology. Curr Biol. 2006;16:R523–R527. - PubMed
-
- Asthagiri AR, Lauffenburger DA. Bioengineering models of cell signaling. Annu Rev Biomed Eng. 2000;2:31–53. - PubMed
-
- Baliga NS. Systems biology. The scale of prediction. Science. 2008;320:1297–1298. - PubMed
-
- Bhalla US, Iyengar R. Emergent properties of networks of biological signaling pathways. Science. 1999;283:381–387. - PubMed
-
- Famili I, Palsson BO. Systemic metabolic reactions are obtained by singular value decomposition of genome-scale stoichiometric matrices. J Theor Biol. 2003;224:87–96. - PubMed
Publication types
MeSH terms
Grants and funding
LinkOut - more resources
Full Text Sources
