. 2009;4(3):e4722.
doi: 10.1371/journal.pone.0004722. Epub 2009 Mar 6.

Transfer of microRNAs by embryonic stem cell microvesicles

Affiliations

Transfer of microRNAs by embryonic stem cell microvesicles

Alex Yuan et al. PLoS One. 2009.

Abstract

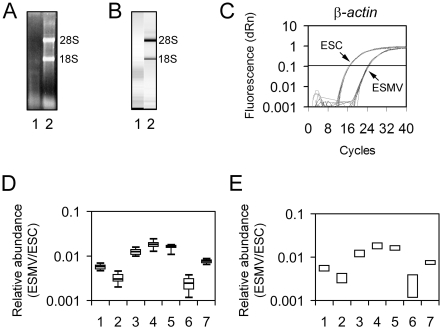
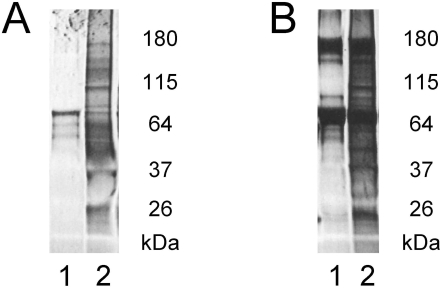
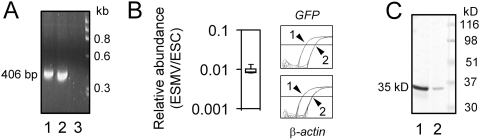
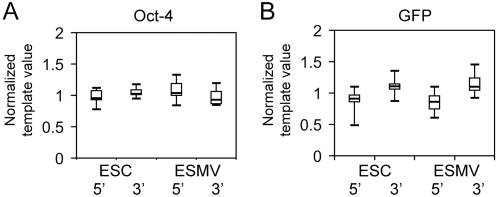
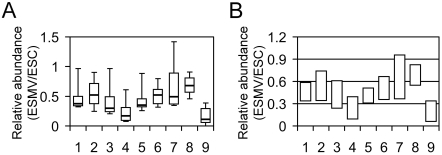
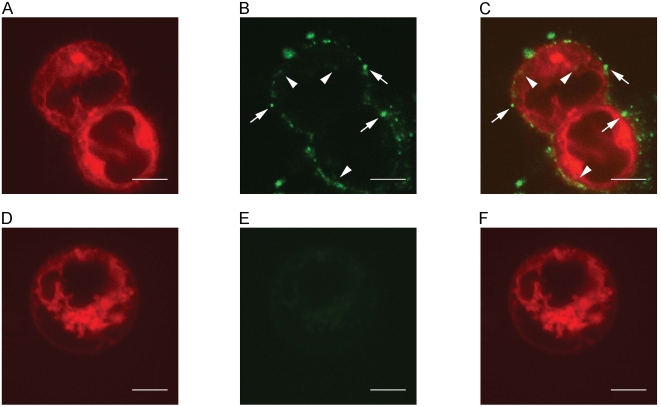
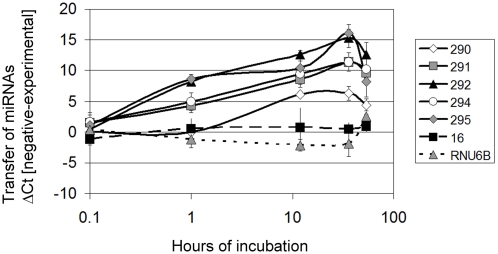
Microvesicles are plasma membrane-derived vesicles released into the extracellular environment by a variety of cell types. Originally characterized from platelets, microvesicles are a normal constituent of human plasma, where they play an important role in maintaining hematostasis. Microvesicles have been shown to transfer proteins and RNA from cell to cell and they are also believed to play a role in intercellular communication. We characterized the RNA and protein content of embryonic stem cell microvesicles and show that they can be engineered to carry exogenously expressed mRNA and protein such as green fluorescent protein (GFP). We demonstrate that these engineered microvesicles dock and fuse with other embryonic stem cells, transferring their GFP. Additionally, we show that embryonic stem cells microvesicles contain abundant microRNA and that they can transfer a subset of microRNAs to mouse embryonic fibroblasts in vitro. Since microRNAs are short (21-24 nt), naturally occurring RNAs that regulate protein translation, our findings open up the intriguing possibility that stem cells can alter the expression of genes in neighboring cells by transferring microRNAs contained in microvesicles. Embryonic stem cell microvesicles may be useful therapeutic tools for transferring mRNA, microRNAs, protein, and siRNA to cells and may be important mediators of signaling within stem cell niches.


Conflict of interest statement

Competing Interests: The authors have declared that no competing interests exist.

Figures

Figure 1
Figure 1. ESMVs contain RNA.
ESMV total RNA lacks 28S and 18S rRNA and consists mostly of RNA below ∼2kb. (A) 1.2% denaturing agarose gel loaded with total RNA from ESMVs (lane 1) and ESCs (lane 2). (B) Digital gel images from capillary electrophoresis of total RNA from ESMVs (lane 1) and ESCs (lane 2). (C) Real time quantitative RT-PCR amplification curves for β-actin reveals much less expression in ESMVs compared with ESCs. (D) The relative abundance of several mRNAs in ESMVs compared with ESCs was determined by real time quantitative RT-PCR using the primers shown in Table 1. The mRNAs tested include gata-4 (lane 1), jag-1 (lane 2), jag-2 (lane 3), nanog (lane 4), oct-4 (lane 5), wnt-3 (lane 6), and β-actin (lane 7). Box plot of relative abundance of all mRNA tested in ESMVs compared with ESCs (n = 8). The boxed area represents the mean±quartile and the whiskers extend out to the minimum and maximum values. Bootstrap ANOVA was performed and a significant difference was detected between all groups (p<0.0001). (E) The 95th percentile confidence interval for each mRNA shown in (D) was determined and plotted on a bar graph. Non overlapping groups are significantly different from each other.
Figure 2
Figure 2. ESMVs contain protein.
Insoluble and soluble protein fractions were isolated from ESMVs and separated on a Tris-glycine buffered 4–20% SDS-polyacrylamide gel, stained with SYPRO Ruby Red. (A) The insoluble protein fraction. Lanes: (1) control medium, (2) ESMVs. (B) The soluble protein fraction after precipitation with TCA. Lanes: (1) control medium, (2) ESMVs. Equivalent amounts of sample and control medium were processed.
Figure 3
Figure 3. ESMVs contain GFP mRNA and protein expressed from a GFP transgene in ESCs.
(A) 300 ng of ESMV RNA from an ESC line expressing GFP were used for RT, and 35 cycles of PCR amplification were performed with the GFP primers shown in Table 1. A 2% agarose gel was loaded with the RT-PCR products from ESMVs (lane 1), ESCs (lane 2), and a “no RT” control of ESMVs (lane 3). A 406bp band corresponding to the GFP amplicon is observed in both the ESMV and ESC lanes. (B) (Left) Box plot of relative abundance of GFP in ESMVs compared with ESCs (n = 8). (Right) Comparison of amplification curves for GFP (top) and β-actin (bottom) in ESCs (1) and ESMVs (2). Note that while quantitative RT-PCR was performed in the linear range of amplification, (panel B), the end-point PCR products shown in panel (A) are only qualitative and well outside of the linear range. (C) Immunoblot of an 8% urea-SDS polyacrylamide/Tris-glycine buffered gel loaded with 20 μg total protein/lane, using polyclonal anti-GFP antibody (1∶1000) and horse anti-rabbit secondary antibody (1∶5000). The secondary antibody was conjugated to alkaline phosphatase and visualized with BCIP/NBT. A single ∼35kD immunoreactive band corresponding to GFP in ESCs (lane 1) and ESMVs (lane 2) was detected.
Figure 4
Figure 4. The RNA in ESMVs is not degraded.
Real time quantitative RT-PCR was used to measure the level of degradation of oct-4 and GFP mRNAs in ESMVs by comparing the 5′ and 3′ amplicon ratios of these transcripts in ESMVs with those in ESCs. Significant levels of degradation were not detected with either transcript. (A) Box plot of normalized 5′ and 3′ template values for oct-4 mRNA in ESCs and ESMVs (n = 9). (B) Box plot of normalized 5′ and 3′ template values for GFP mRNA in ESCs and ESMVs (n = 12). The boxed area represents the mean±quartile and the whiskers extend out to the minimum and maximum values. Bootstrap t-tests were performed to compare the 5′:3′ ratios for each transcript in ESCs and ESMVs. No significant difference was detected between the ESC group and ESMV group for either transcript (p>0.1).
Figure 5
Figure 5. ESMVs contain miRNAs.
The relative abundance of several miRNAs in ESMVs compared with ESCs was determined by real time quantitative RT-PCR. The miRNAs tested include miR-16 (lane 1), miR-21 (lane 2), miR-22 (lane 3), miR-290 (lane 4), miR-291-3p (lane 5), miR-292-3p (lane 6), miR-294 (lane 7), miR-295 (lane 8), and the small nuclear RNA, RNU6b (lane 9). (A) Box plots of relative abundance in ESMVs compared with ESCs (n = 9). The boxed area represents the mean±quartile and the whiskers extend out to the minimum and maximum values. Bootstrap ANOVA was performed and a significant difference was detected between all groups (p = 0.008). (B) The 95th percentile confidence interval for each miRNA was determined and plotted on a bar graph. Non-overlapping groups are significantly different from each other. RNU6b is significantly less abundant than all miRNAs tested except for miR-22, miR-290, and miR-291. The majority of miRNAs tested do not differ significantly from one another except for miR-295, which is significantly more abundant than miR-290 and miR-291.
Figure 6
Figure 6. ESMVs transfer GFP.
ESCs without the GFP transgene were labeled with DiD and then incubated with ESMVs containing GFP. All confocal images were taken using a 100×, 1.4 NA objective with the pinhole set to 1 airy unit. (A) DiD signal from ESCs incubated with ESMVs. (B) GFP signal from ESCs incubated with ESMVs. Arrows indicate punctate signal, likely representing docked vesicles. Arrowheads indicate diffuse signal, likely from the diffusion of GFP inside the cell or from the production of newly translated GFP. (C) Overlay of A+B. (D) DiD signal from control ESCs without ESMVs. (E) No GFP signal can be detected in the absence of ESMVs. (F) Overlay of D+E. All scale bars are 5 μm.
Figure 7
Figure 7. ESMVs transfer miRNAs.
MEFs were incubated with ESMVs for 1, 12, 36, or 54 hours and transfer of miRNAs was determined by real time quantitative RT-PCR (n = 5). Time point 0 represents MEFs without ESMVs. The difference in Ct values between the negative control (MEFs alone) and each experimental group (miR-290, miR-291-3p, miR-292-3p, miR-294, miR-295, miR-16, and RNU6b) is shown. Positive values indicate transfer of miRNA.

References

    1. Wolf P. The nature and significance of platelet products in human plasma. Br J Haematol. 1967;13:269–288. - PubMed
    1. Abrahams VM, Straszewski SL, Kamsteeg M, Hanczaruk B, Schwartz PE, et al. Epithelial ovarian cancer cells secrete functional Fas ligand. Cancer Res. 2003;63:5573–5581. - PubMed
    1. Mack M, Kleinschmidt A, Bruhl H, Klier C, Nelson PJ, et al. Transfer of the chemokine receptor CCR5 between cells by membrane-derived microparticles: a mechanism for cellular human immunodeficiency virus 1 infection. Nat Med. 2000;6:769–775. - PubMed
    1. Martinez MC, Tesse A, Zobairi F, Andriantsitohaina R. Shed membrane microparticles from circulating and vascular cells in regulating vascular function. Am J Physiol Heart Circ Physiol. 2005;288:H1004–1009. - PubMed
    1. Morel O, Toti F, Hugel B, Freyssinet JM. Cellular microparticles: a disseminated storage pool of bioactive vascular effectors. Curr Opin Hematol. 2004;11:156–164. - PubMed

Publication types

MeSH terms