. 2009;4(3):e4729.
doi: 10.1371/journal.pone.0004729. Epub 2009 Mar 6.

Genetic variation and population substructure in outbred CD-1 mice: implications for genome-wide association studies

Affiliations

Genetic variation and population substructure in outbred CD-1 mice: implications for genome-wide association studies

Kimberly A Aldinger et al. PLoS One. 2009.

Abstract

Outbred laboratory mouse populations are widely used in biomedical research. Since little is known about the degree of genetic variation present in these populations, they are not widely used for genetic studies. Commercially available outbred CD-1 mice are drawn from an extremely large breeding population that has accumulated many recombination events, which is desirable for genome-wide association studies. We therefore examined the degree of genome-wide variation within CD-1 mice to investigate their suitability for genetic studies. The CD-1 mouse genome displays patterns of linkage disequilibrium and heterogeneity similar to wild-caught mice. Population substructure and phenotypic differences were observed among CD-1 mice obtained from different breeding facilities. Differences in genetic variation among CD-1 mice from distinct facilities were similar to genetic differences detected between closely related human populations, consistent with a founder effect. This first large-scale genetic analysis of the outbred CD-1 mouse strain provides important considerations for the design and analysis of genetic studies in CD-1 mice.


Conflict of interest statement

Competing Interests: The authors have declared that no competing interests exist.

Figures

Figure 1
Figure 1. Chromosomal distribution of MAFs.
For each chromosome, chromosomal position in Mb is shown on the X-axis, and MAF is plotted on the Y-axis. MAF values for individual SNPs are shown in black, the blue line represents mean MAF for each chromosome, and locations of monomorphic SNPs are in red.
Figure 2
Figure 2. LD between ∼16,000 pairs of SNPs in CD-1 mice.
The r2 measure of LD is shown as a function of physical distance for all common SNP pairs (top) and for common SNP pairs with an inter-SNP interval of ≤10 Mb (bottom) within Cohorts 1 and 2.
Figure 3
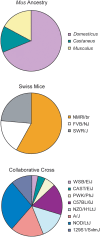
Figure 3. Inbred mouse contributions to CD-1 genomic variation as determined by structure analysis.
Outbred CD-1 mice are represented by three pie charts that are partitioned into K colored segments to represent the CD-1 estimated membership K inbred subpopulations. Among wild-derived inbred strains (K = 3) representing the Mus subspecies, CD-1 mice are mostly M. m. domesticus. Among Swiss inbred mice (K = 3), CD-1 mice share the most genetic similarity with NMRI/br. CD-1 mice are 58% NMRI/br, 24% SWR/J and 18% FVB/NJ. Among CC inbred mice (K = 8), outbred CD-1 mice are most geneticly similar to NOD/LtJ (27%) and less similar to the other 7 strains (3% WSB/EiJ, 4% CAST/EiJ, 6% PWK/PhJ, 17% C57BL/6J, 14% NZO/H1LtJ, 18% A/J, and 11% 129S1/SvlmJ).
Figure 4
Figure 4. Estimated population structure among CD-1 mice.
Each Cohort 2 individual is represented by a vertical bar that is partitioned into 3 colored segments (Black–NY, Yellow–MI, Blue–NC) to represent the individual's subpopulation membership. Breeding facilities are labeled above the panels. These results were consistent over 5 independent runs of the program.
Figure 5
Figure 5. Behavioral phenotypes observed in Cohort 2.
Frequency histograms for locomotor activity in an open field and the percent time spent freezing in response to a tone (freezing-to-tone) that was previously paired with a footshock are shown. The average freezing-to-tone scores (±SEM) for CD-1 mice grouped according facility of origin (Black–NY, Yellow–MI, Blue–NC) are also shown. *P = 0.001.
Figure 6
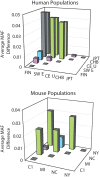
Figure 6. Human and mouse population comparisons.
Pair-wise comparisons of average MAF differences among human founder (FIN–Finnish, SWE–Swedish) and HapMap (CEU–CEPH, CHB–Chinese, JPT–Japan) populations and CD-1 mouse populations (C1–Cohort 1, MI–Michigan, NC–North Carolina, NY–New York). Colors represent similar differences observed between pairs of human and mouse populations (purple<0.01, blue = 0.01, green>0.02).

Similar articles

Cited by

References

    1. Cui S, Chesson C, Hope R. Genetic variation within and between strains of outbred Swiss mice. Lab Anim. 1993;27:116–123. - PubMed
    1. Rice MC, O'Brien SJ. Genetic variance of laboratory outbred Swiss mice. Nature. 1980;283:157–161. - PubMed
    1. Chia R, Achilli F, Festing MF, Fisher EM. The origins and uses of mouse outbred stocks. Nat Genet. 2005;37:1181–1186. - PubMed
    1. Brown JA, Chua SC, Jr, Liu SM, Andrews MT, Vandenbergh JG. Spontaneous mutation in the db gene results in obesity and diabetes in CD-1 outbred mice. Am J Physiol Regul Integr Comp Physiol. 2000;278:R320–330. - PubMed
    1. Lehoczky JA, Cai WW, Douglas JA, Moran JL, Beier DR, et al. Description and genetic mapping of Polypodia: an X-linked dominant mouse mutant with ectopic caudal limbs and other malformations. Mamm Genome. 2006;17:903–913. - PubMed

Publication types

LinkOut - more resources