. 2009 Jun 1;46(11):1488-99.
doi: 10.1016/j.freeradbiomed.2009.02.021. Epub 2009 Mar 3.

Oxidative stress alters base excision repair pathway and increases apoptotic response in apurinic/apyrimidinic endonuclease 1/redox factor-1 haploinsufficient mice

Affiliations

Oxidative stress alters base excision repair pathway and increases apoptotic response in apurinic/apyrimidinic endonuclease 1/redox factor-1 haploinsufficient mice

Archana Unnikrishnan et al. Free Radic Biol Med. .

Abstract

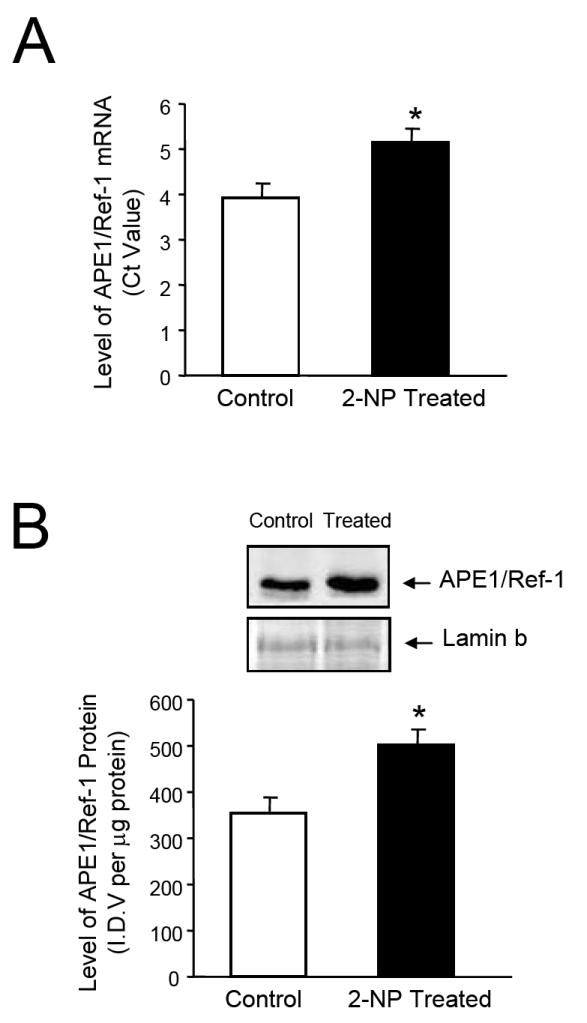
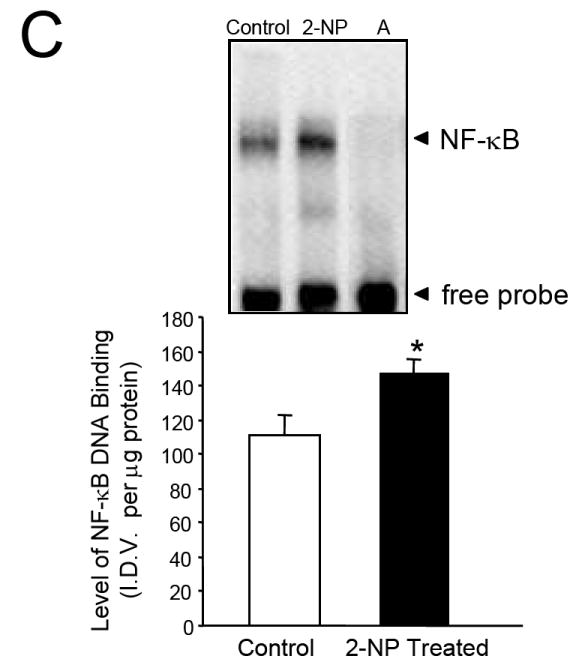
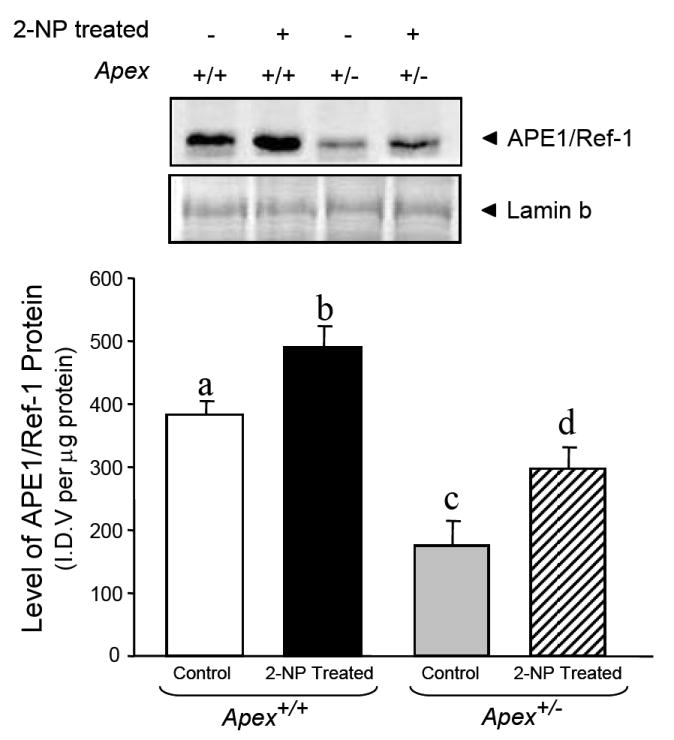
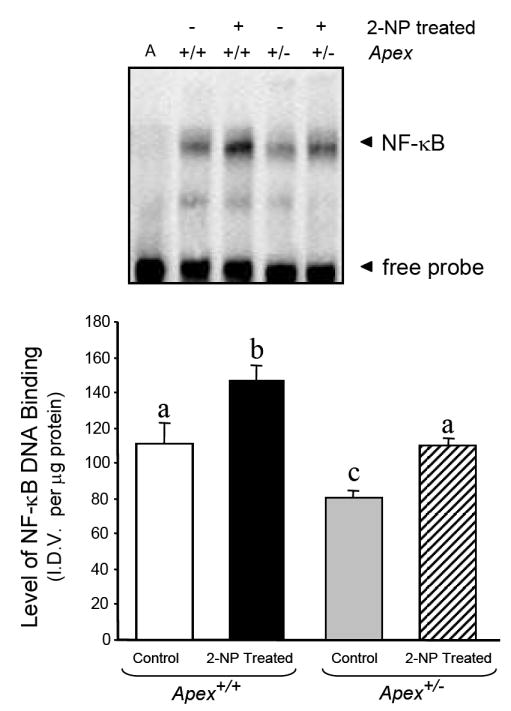
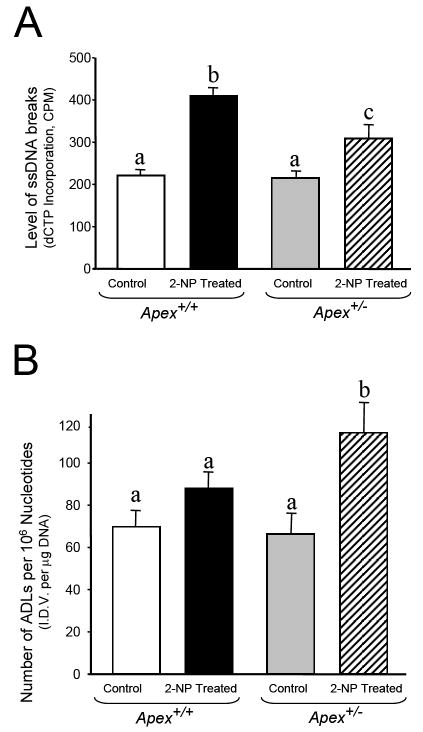
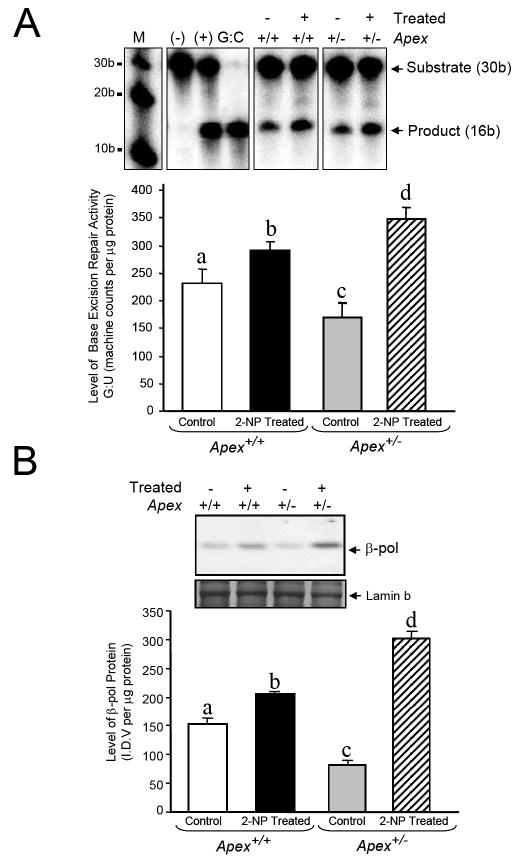
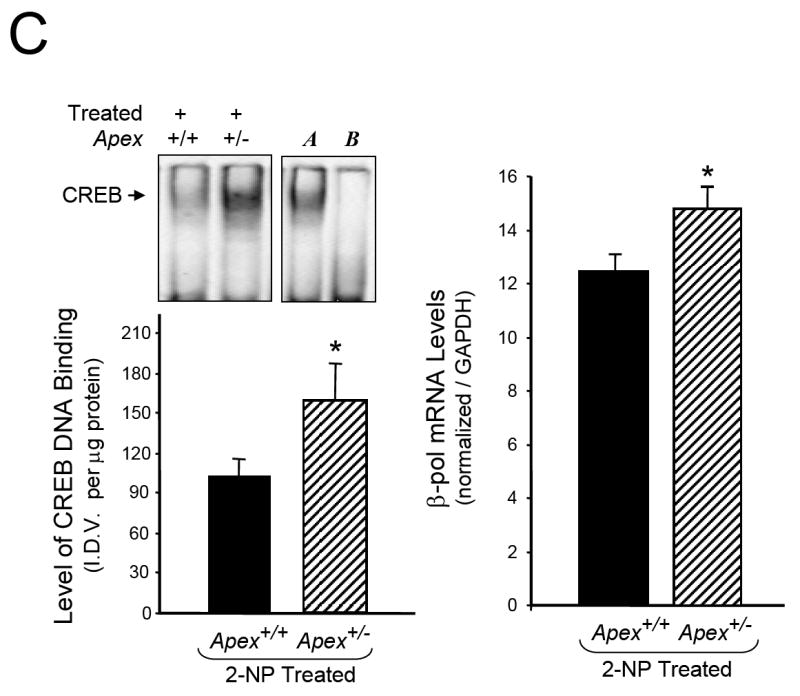
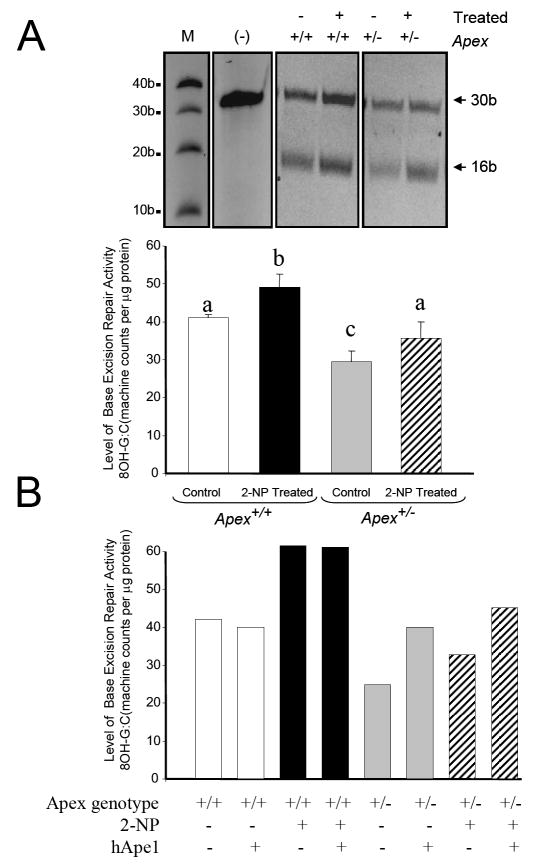
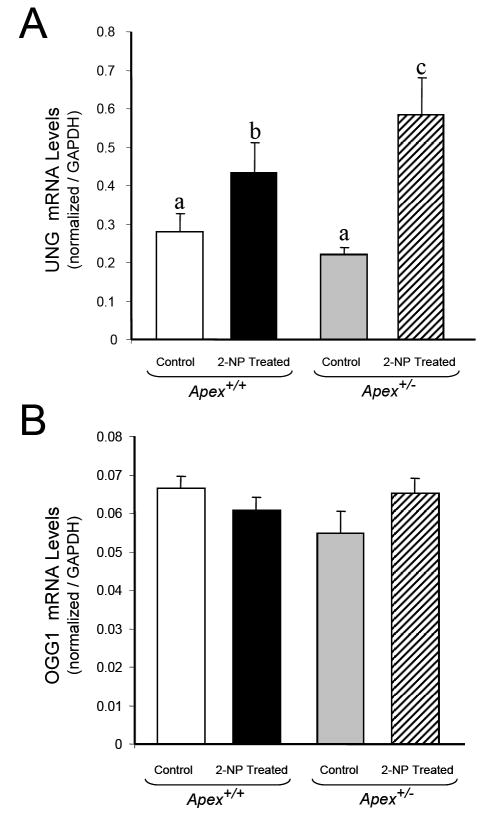
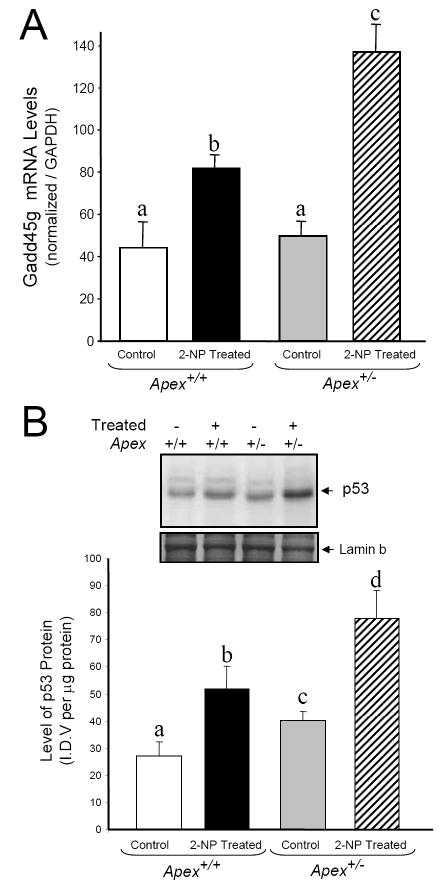
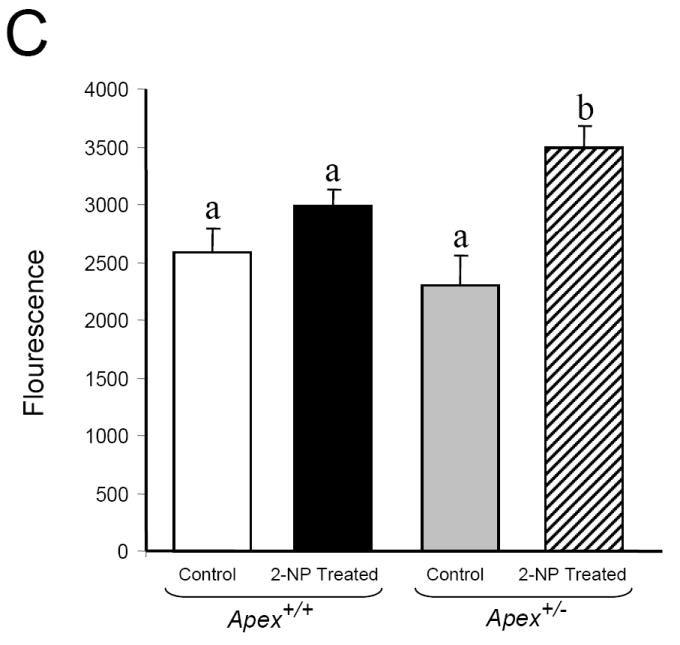
Apurinic/apyrimidinic endonuclease 1/redox factor-1 (APE1/Ref-1) is the redox regulator of multiple stress-inducible transcription factors, such as NF-kappaB, and the major 5'-endonuclease in base excision repair (BER). We utilized mice containing a heterozygous gene-targeted deletion of APE1/Ref-1 (Apex(+/-)) to determine the impact of APE1/Ref-1 haploinsufficiency on the processing of oxidative DNA damage induced by 2-nitropropane (2-NP) in the liver tissue of mice. APE1/Ref-1 haploinsufficiency results in a significant decline in NF-kappaB DNA-binding activity in response to oxidative stress in liver. In addition, loss of APE1/Ref-1 increases the apoptotic response to oxidative stress, in which significant increases in GADD45g expression, p53 protein stability, and caspase activity are observed. Oxidative stress displays a differential impact on monofunctional (UNG) and bifunctional (OGG1) DNA glycosylase-initiated BER in the liver of Apex(+/-) mice. APE1/Ref-1 haploinsufficiency results in a significant decline in the repair of oxidized bases (e.g., 8-OHdG), whereas removal of uracil is increased in liver nuclear extracts of mice using an in vitro BER assay. Apex(+/-) mice exposed to 2-NP displayed a significant decline in 3'-OH-containing single-strand breaks and an increase in aldehydic lesions in their liver DNA, suggesting an accumulation of repair intermediates of failed bifunctional DNA glycosylase-initiated BER.


Figures

Fig. 1
Fig. 1
Expression and activity of APE1/Ref-1 in response to 2-NP in vivo. (A) APE1/Ref-1 mRNA expression was quantified using a real-time PCR and the data were normalized using GAPDH. Values represent an average (± S.E.M.) for data obtained from 5 mice in each group (B) The level of the 37-kDa APE1/Ref-1 protein in 200 μg of liver nuclear extract as determined by western blot analysis. Values represent an average (± S.E.M.) for data obtained from 5 mice in each group (C) The level of APE1/Ref-1 redox-activation of NF-κB in 10 μg of live nuclear extract as determined using EMSA. Values represent an average (± S.E.M.) for data obtained from 5 mice in each group and are representative of separate independent experiments. (I.D.V.): integrated density value corresponding to the level of APE1/Ref-1 protein as quantified by an AlphaInnotech ChemiImager™; Lane A: nuclear extracts incubated in the presence of 100X molar excess of unlabeled NF-kB consensus DNA to confirm binding specificity; (*): value significantly different from control, wild-type mice at P < 0.05; (**): value significantly different from control, Apex+/- mice at P < 0.05. Lamin B protein level served as nuclear protein loading control. The picture depicts the representative sample from each group.
Fig. 1
Fig. 1
Expression and activity of APE1/Ref-1 in response to 2-NP in vivo. (A) APE1/Ref-1 mRNA expression was quantified using a real-time PCR and the data were normalized using GAPDH. Values represent an average (± S.E.M.) for data obtained from 5 mice in each group (B) The level of the 37-kDa APE1/Ref-1 protein in 200 μg of liver nuclear extract as determined by western blot analysis. Values represent an average (± S.E.M.) for data obtained from 5 mice in each group (C) The level of APE1/Ref-1 redox-activation of NF-κB in 10 μg of live nuclear extract as determined using EMSA. Values represent an average (± S.E.M.) for data obtained from 5 mice in each group and are representative of separate independent experiments. (I.D.V.): integrated density value corresponding to the level of APE1/Ref-1 protein as quantified by an AlphaInnotech ChemiImager™; Lane A: nuclear extracts incubated in the presence of 100X molar excess of unlabeled NF-kB consensus DNA to confirm binding specificity; (*): value significantly different from control, wild-type mice at P < 0.05; (**): value significantly different from control, Apex+/- mice at P < 0.05. Lamin B protein level served as nuclear protein loading control. The picture depicts the representative sample from each group.
Fig. 2
Fig. 2
Effect of 2-NP on APE1/Ref-1 expression levels in Apex+/- mice. The level of the 37-kDa APE1/Ref-1 protein in 200 μg of liver nuclear extract was determined by western blot analysis. Values represent an average (± S.E.M.) for data obtained from 5 mice in each group and are representative of separate independent experiments. (SDS-PAGE]: the level of APE1/Ref-1 protein was normalized based on the amount of protein loaded on each gel. (I.D.V.): integrated density value corresponding to the level of APE1/Ref-1 protein as quantified by an AlphaInnotech ChemiImager™; Values with different letter superscripts indicate significant differences at P < 0.05. Lamin B protein level served as nuclear protein loading control. The picture depicts the representative sample from each group.
Fig. 3
Fig. 3
Effect of 2-NP on APE1/Ref-1 redox activation of NF-κB in Apex+/- mice. The level of NF-κB DNA binding in 10 μg of liver nuclear extract was determined using EMSA. Values represent an average (± S.E.M.) for data obtained from 5 mice in each group and are representative of separate independent experiments. (I.D.V.): integrated density value corresponding to the level of NF-κB DNA binding as quantified by an AlphaInnotech ChemiImager™; Lane A: nuclear extracts incubated in the presence of 100X molar excess of unlabeled NF-κB consensus DNA to confirm binding specificity; Values with different letter superscripts indicate significant differences at P < 0.05. The picture depicts the representative sample from each group.
Fig. 4
Fig. 4
DNA Damage analysis in liver DNA of Apex+/- mice injected with 2-NP. (A) The level of 3’-OH single-strand breaks as determined by the ROPS assay in liver of wild-type (Apex+/+) and Apex+/- mice treated with 100 mg/kg body weight 2-NP. (B) The level of Aldehydic lesions as determined by the ASB assay in liver of wild-type (Apex+/+) and Apex+/- mice treated with 100 mg/kg body weight 2-NP.Values represent an average (± S.E.M.) for data obtained from 5 mice in each group and are representative of separate identical experiments. (C.P.M.): machine counts per minute corresponding to the level of α-[32P]dCTP incorporation as quantified by a Packard scintillation counter; (I.D.V.): integrated density value corresponding to the level of DNA as quantified by an AlphaInnotech ChemiImager™; Values with different letter superscripts indicate significant differences at P < 0.05.
Fig. 5
Fig. 5
Effect of APE1/Ref-1 haploinsufficiency and 2-NP on G:U mismatch BER, DNA polymerase β expression and CREB DNA binding activity. (A) The in vitro G:U mismatch BER was conducted using nuclear extracts from liver of control and 2-NP treated Apex+/+ and Apex+/- mice. Base excision repair (BER) reaction products were resolved on a sequencing gel and visualized by autoradiography. Repair activity is visualized by the appearance of a 16b fragment. The relative level of BER was quantified using a Bio-Rad Molecular Imager® System. The data were normalized based on the amount of protein used in each reaction and expressed as machine counts per μg of protein. (B) The level of the 39-kDa β-pol protein in 200 μg of liver nuclear extract was determined by western blot analysis. (SDS-PAGE): the level of β-pol protein was normalized based on the amount of protein loaded on each gel. (C) The level of CREB DNA binding in 10 μg of liver nuclear extract was determined using EMSA and β-pol mRNA expression level as quantified using a real-time PCR and normalized with GAPDH Values represent an average (± S.E.M.) for data obtained from 5 mice in each group and are representative of separate identical experiments. (M): molecular weight standard; (-): negative control, G:U mismatch oligonucleotide incubated in the absence of nuclear extract and treated with HpaII restriction endonuclease; (+): positive control, G:U mismatch oligonucleotide incubated with recombinant β-pol and treated with HpaII restriction endonuclease; (G:C): positive control, G:C oligonucleotide incubated with nuclear extract and treated with HpaII restriction endonuclease; (I.D.V.): integrated density value corresponding to the level of β-pol protein and the level of CREB DNA binding as quantified by an AlphaInnotech ChemiImager™; Lane A & B: nuclear extracts incubated in the presence of 100X molar excess of mutated and unlabeled CRE sequence with β-pol flanking region respectively to confirm binding specificity; Lamin B protein level served as nuclear protein loading control. Values with different letter superscripts indicate significant differences at P < 0.05. (*): value significantly different from wildtype (Apex+/+) mice treated with 2-NP at P < 0.05. The picture depicts the representative sample from each group.
Fig. 5
Fig. 5
Effect of APE1/Ref-1 haploinsufficiency and 2-NP on G:U mismatch BER, DNA polymerase β expression and CREB DNA binding activity. (A) The in vitro G:U mismatch BER was conducted using nuclear extracts from liver of control and 2-NP treated Apex+/+ and Apex+/- mice. Base excision repair (BER) reaction products were resolved on a sequencing gel and visualized by autoradiography. Repair activity is visualized by the appearance of a 16b fragment. The relative level of BER was quantified using a Bio-Rad Molecular Imager® System. The data were normalized based on the amount of protein used in each reaction and expressed as machine counts per μg of protein. (B) The level of the 39-kDa β-pol protein in 200 μg of liver nuclear extract was determined by western blot analysis. (SDS-PAGE): the level of β-pol protein was normalized based on the amount of protein loaded on each gel. (C) The level of CREB DNA binding in 10 μg of liver nuclear extract was determined using EMSA and β-pol mRNA expression level as quantified using a real-time PCR and normalized with GAPDH Values represent an average (± S.E.M.) for data obtained from 5 mice in each group and are representative of separate identical experiments. (M): molecular weight standard; (-): negative control, G:U mismatch oligonucleotide incubated in the absence of nuclear extract and treated with HpaII restriction endonuclease; (+): positive control, G:U mismatch oligonucleotide incubated with recombinant β-pol and treated with HpaII restriction endonuclease; (G:C): positive control, G:C oligonucleotide incubated with nuclear extract and treated with HpaII restriction endonuclease; (I.D.V.): integrated density value corresponding to the level of β-pol protein and the level of CREB DNA binding as quantified by an AlphaInnotech ChemiImager™; Lane A & B: nuclear extracts incubated in the presence of 100X molar excess of mutated and unlabeled CRE sequence with β-pol flanking region respectively to confirm binding specificity; Lamin B protein level served as nuclear protein loading control. Values with different letter superscripts indicate significant differences at P < 0.05. (*): value significantly different from wildtype (Apex+/+) mice treated with 2-NP at P < 0.05. The picture depicts the representative sample from each group.
Fig. 6
Fig. 6
Effect of APE1/Ref-1 haploinsufficiency and 2-NP on 8 OH G:C BER and the consequence of hApe1 enrichment on the repair capacity. (A) The in vitro 8-OH G:C BER was conducted using nuclear extracts from liver of control and 2-NP treated Apex+/+ and Apex+/- mice in the presence of 1.6 U of ogg1 enzyme (New England Biolab, MA). Base excision repair (BER) reaction products were resolved on a sequencing gel. Repair activity is visualized by the appearance of a 16b fragment. The relative level of BER was quantified using an Bio-rad ChemiImager™. The data were normalized based on the amount of protein used in each reaction and expressed as machine counts per μg of protein. (B) The in vitro 8-OH G:C BER was conducted with human Ape1/Ref-1 (hApe1) enrichment. Values represent an average (± S.E.M.) for data obtained from 5 mice in each group and are representative of separate identical experiments. (M): molecular weight standard; (-): negative control, G:U mismatch oligonucleotide incubated in the absence of nuclear extract and treated with HpaII restriction endonuclease; Values with different letter superscripts indicate significant differences at P < 0.05. The picture depicts the representative sample from each group.
Fig. 7
Fig. 7
Effect of 2-NP on UNG and OGG1 expression in Apex+/- mice. (A) UNG mRNA expression level in control and 2-NP treated Apex+/+ and Apex+/- mice as quantified using real-time PCR and normalized against GAPDH. (B) OGG1 mRNA expression level in control and 2-NP treated Apex+/+ and Apex+/- mice as quantified using real-time PCR and normalized against GAPDH. Values represent an average (± S.E.M.) for data obtained from 5 mice in each group and are representative of separate identical experiments; Values with different letter superscripts indicate significant differences at P < 0.05.
Fig. 8
Fig. 8
Effect of 2-NP on apoptosis in Apex+/- mice. (A) GADD45g mRNA expression level was quantified using real-time PCR and normalized with GAPDH. (B) The level of the p53 protein in 200 μg of liver nuclear extract was determined by western blot analysis. (SDS-PAGE): the level of p53 protein was normalized based on the amount of protein loaded on each gel. (C) The level of Caspase-3 activity in liver cytosolic extract as determined by Caspase-3 enzyme assay. Values represent an average (± S.E.M.) for data obtained from 5 mice in each group and are representative of separate identical experiments; Values with different letter superscripts indicate significant differences at P < 0.05. Lamin B protein level served as nuclear protein loading control. The picture depicts the representative sample from each group.
Fig. 8
Fig. 8
Effect of 2-NP on apoptosis in Apex+/- mice. (A) GADD45g mRNA expression level was quantified using real-time PCR and normalized with GAPDH. (B) The level of the p53 protein in 200 μg of liver nuclear extract was determined by western blot analysis. (SDS-PAGE): the level of p53 protein was normalized based on the amount of protein loaded on each gel. (C) The level of Caspase-3 activity in liver cytosolic extract as determined by Caspase-3 enzyme assay. Values represent an average (± S.E.M.) for data obtained from 5 mice in each group and are representative of separate identical experiments; Values with different letter superscripts indicate significant differences at P < 0.05. Lamin B protein level served as nuclear protein loading control. The picture depicts the representative sample from each group.

Similar articles

Cited by

References

    1. Evans MD, Dizdaroglu M, Cooke MS. Oxidative DNA damage and disease: induction, repair and significance. Mutat Res. 2004;567:1–61. - PubMed
    1. Mullaart E, Lohman PHM, Berends F, Vijg J. DNA damage metabolism and aging. Mutat Res. 1990;237:189–210. - PubMed
    1. Jackson AL, Loeb LA. The contribution of endogenous sources of DNA damage to the multiple mutations in cancer. Mutat Res. 2001;477:7–21. - PubMed
    1. Sancar A, Lindsey-Boltz LA, Unsal-Kacmaz K, Linn S. Molecular mechanisms of mammalian DNA repair and the DNA damage checkpoints. Annu Rev Biochem. 2004;73:39–85. - PubMed
    1. Slupphaug G, Kavli B, Krokan HE. The interacting pathways for prevention and repair of oxidative DNA damage. Mutat Res. 2003;531:231–251. - PubMed

Publication types

MeSH terms