

Parafascicular thalamic nucleus activity in a rat model of Parkinson's disease
- PMID: 19268664
- PMCID: PMC2727617
- DOI: 10.1016/j.expneurol.2009.02.010
Parafascicular thalamic nucleus activity in a rat model of Parkinson's disease
Abstract
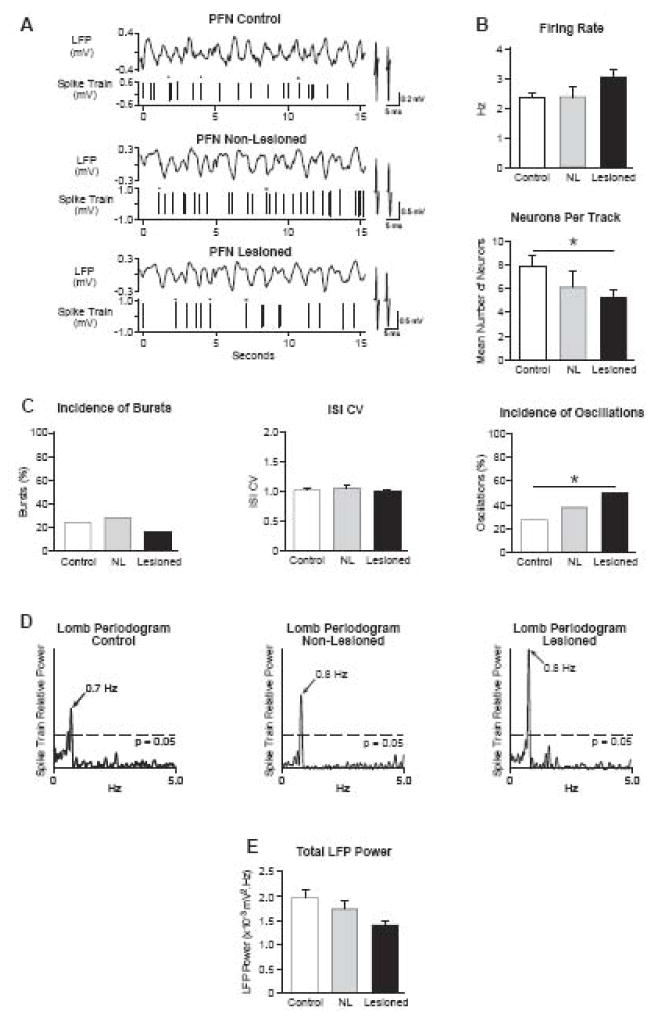
Parkinson's disease is associated with increased oscillatory firing patterns in basal ganglia output, which are thought to disrupt thalamocortical activity. However, it is unclear how specific thalamic nuclei are affected by these changes in basal ganglia activity. The thalamic parafascicular nucleus (PFN) receives input from basal ganglia output nuclei and directly projects to the subthalamic nucleus (STN), striatum and cortex; thus basal ganglia-mediated changes on PFN activity may further impact basal ganglia and cortical functions. To investigate the impact of increased oscillatory activity in basal ganglia output on PFN activity after dopamine cell lesion, PFN single-unit and local field potential activities were recorded in neurologically intact (control) rats and in both non-lesioned and dopamine lesioned hemispheres of unilateral 6-hydroxydopamine lesioned rats anesthetized with urethane. Firing rates were unchanged 1-2 weeks after lesion; however, significantly fewer spontaneously active PFN neurons were evident. Firing pattern assessments after lesion showed that a larger proportion of PFN spike trains had 0.3-2.5 Hz oscillatory activity and significantly fewer spike trains exhibited low threshold calcium spike (LTS) bursts. In paired recordings, more PFN-STN spike oscillations were significantly correlated, but as these oscillations were in-phase, results are inconsistent with feedforward control of PFN activity by inhibitory oscillatory basal ganglia output. Furthermore, the decreased incidence of LTS bursts is incompatible with inhibitory basal ganglia output inducing rebound bursting in PFN after dopamine lesion. Together, results show that robust oscillatory activity observed in basal ganglia output nuclei after dopamine cell lesion does not directly drive changes in PFN oscillatory activity.
Figures


Comment in
-
Facing the lack of anti-phase oscillation in the parafascicular nucleus after dopamine depletion.Exp Neurol. 2009 Sep;219(1):62-5. doi: 10.1016/j.expneurol.2009.05.031. Epub 2009 Jun 6. Exp Neurol. 2009. PMID: 19501087 Review.
Similar articles
-
Phase relationships support a role for coordinated activity in the indirect pathway in organizing slow oscillations in basal ganglia output after loss of dopamine.Neuroscience. 2007 Jan 19;144(2):762-76. doi: 10.1016/j.neuroscience.2006.10.006. Epub 2006 Nov 15. Neuroscience. 2007. PMID: 17112675 Free PMC article.
-
Subthalamic nucleus lesions reduce low frequency oscillatory firing of substantia nigra pars reticulata neurons in a rat model of Parkinson's disease.Brain Res. 2001 Jun 15;904(1):93-103. doi: 10.1016/s0006-8993(01)02489-1. Brain Res. 2001. PMID: 11516415
-
Facing the lack of anti-phase oscillation in the parafascicular nucleus after dopamine depletion.Exp Neurol. 2009 Sep;219(1):62-5. doi: 10.1016/j.expneurol.2009.05.031. Epub 2009 Jun 6. Exp Neurol. 2009. PMID: 19501087 Review.
-
Dopamine lesion-induced changes in subthalamic nucleus activity are not associated with alterations in firing rate or pattern in layer V neurons of the anterior cingulate cortex in anesthetized rats.Eur J Neurosci. 2007 Oct;26(7):1925-39. doi: 10.1111/j.1460-9568.2007.05814.x. Eur J Neurosci. 2007. PMID: 17897398
-
Impact of surgery targeting the caudal intralaminar thalamic nuclei on the pathophysiological functioning of basal ganglia in a rat model of Parkinson's disease.Brain Res Bull. 2009 Feb 16;78(2-3):80-4. doi: 10.1016/j.brainresbull.2008.08.010. Epub 2008 Nov 12. Brain Res Bull. 2009. PMID: 18790021 Review.
Cited by
-
Deep brain stimulation of the center median-parafascicular complex of the thalamus has efficient anti-parkinsonian action associated with widespread cellular responses in the basal ganglia network in a rat model of Parkinson's disease.J Neurosci. 2010 Jul 21;30(29):9919-28. doi: 10.1523/JNEUROSCI.1404-10.2010. J Neurosci. 2010. PMID: 20660274 Free PMC article.
-
Gamma band activity in the developing parafascicular nucleus.J Neurophysiol. 2012 Feb;107(3):772-84. doi: 10.1152/jn.00677.2011. Epub 2011 Nov 16. J Neurophysiol. 2012. PMID: 22090455 Free PMC article.
-
Delta oscillations are a robust biomarker of dopamine depletion severity and motor dysfunction in awake mice.J Neurophysiol. 2020 Aug 1;124(2):312-329. doi: 10.1152/jn.00158.2020. Epub 2020 Jun 24. J Neurophysiol. 2020. PMID: 32579421 Free PMC article.
-
In vivo electrophysiology of nigral and thalamic neurons in alpha-synuclein-overexpressing mice highlights differences from toxin-based models of parkinsonism.J Neurophysiol. 2013 Dec;110(12):2792-805. doi: 10.1152/jn.00441.2013. Epub 2013 Sep 25. J Neurophysiol. 2013. PMID: 24068758 Free PMC article.
-
Is the loss of thalamostriatal neurons protective in parkinsonism?Parkinsonism Relat Disord. 2009 Dec;15 Suppl 3(Suppl 3):S162-6. doi: 10.1016/S1353-8020(09)70806-5. Parkinsonism Relat Disord. 2009. PMID: 20082981 Free PMC article.
References
-
- Albin RL, Young AB, Penney JB. The functional anatomy of basal ganglia disorders. Trends Neurosci. 1989;12:366–375. - PubMed
-
- Angaut P, Cicirata F, Serapide P. Topographic organization of the cerebellothalamic projections in the rat. An autoradiographic study. Neuroscience. 1985;15:389–401. - PubMed
-
- Aymerich MS, Barroso-Chinea P, Perez-Manso M, Munoz-Patino AM, Moreno-Igoa M, Gonzalez-Hernandez T, Lanciego JL. Consequences of unilateral nigrostriatal denervation on the thalamostriatal pathway in rats. Eur J Neurosci. 2006;23:2099–2108. - PubMed
-
- Batschelet E. Circular Statistics in Biology. New York: Academic Press; 1981.
Publication types
MeSH terms
Substances
Grants and funding
LinkOut - more resources
Full Text Sources
Medical
