. 2009 Aug;48(4):361-7.
doi: 10.1016/j.ymeth.2009.02.018. Epub 2009 Mar 6.

Detection of gene loops by 3C in yeast

Affiliations

Detection of gene loops by 3C in yeast

Badri Nath Singh et al. Methods. 2009 Aug.

Abstract

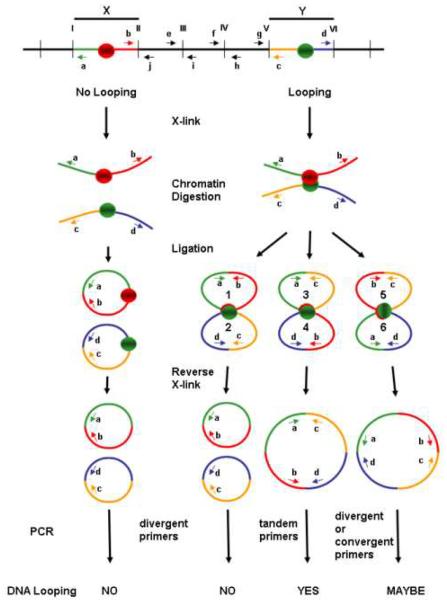
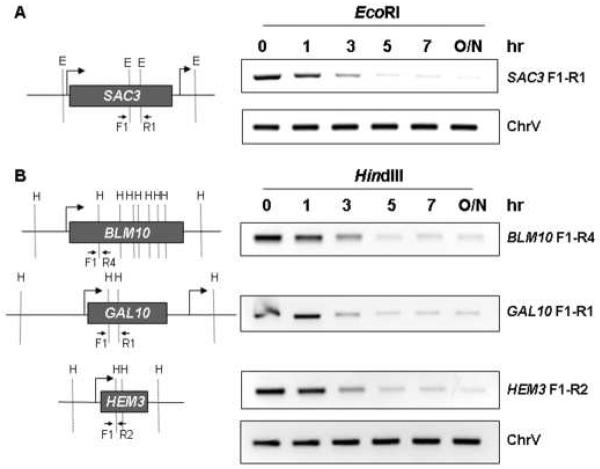
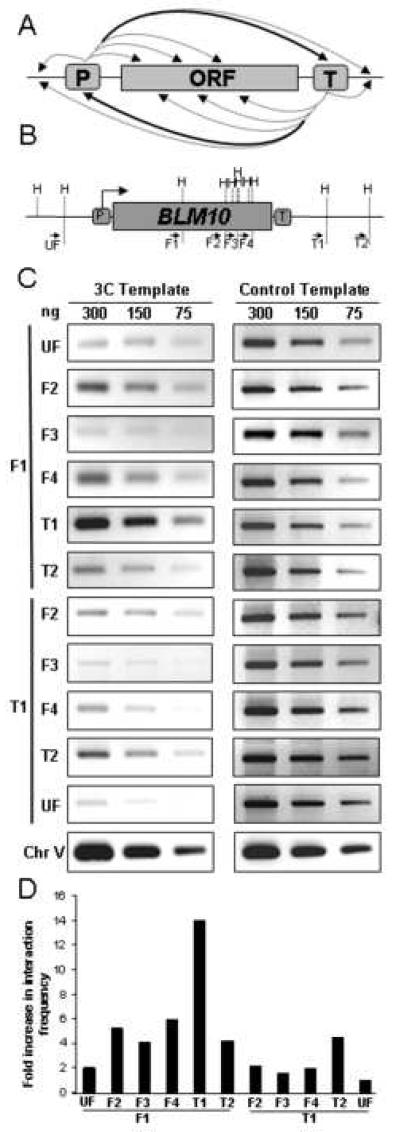
"Chromosome conformation capture" (3C) is a powerful method to detect physical interaction between any two genomic loci. 3C involves formaldehyde crosslinking to stabilize transient interactions, followed by restriction digestion, ligation and locus-specific PCR. Accordingly, 3C reveals complex three-dimensional interactions between distal genetic elements within intact cells at high resolution. Here, we describe a modified 3C protocol designed for detection of transient chromatin interactions in the yeast Saccharomyces cerevisiae. Using this protocol, we are able to detect juxtaposition of promoter and terminator regions of genes with ORFs as short as 1kb in length. We anticipate that this method will be generally applicable to detect dynamic, short-range chromatin interactions and will facilitate the characterization of gene loops and their functional consequences.


Figures

Fig. 1
Fig. 1. Schematic depiction of the outcome of 3C analysis using divergent, convergent and tandem primer pairs
Primers are denoted by lower case letters a – j. Restrictions sites are denoted by roman numerals I – VI. DNA fragments X and Y are either juxtaposed such that crosslinking occurs between the regions depicted as red and green circles (right side) or are not juxtaposed and do not become crosslinked (left side). PCR products from tandem primer pairs a &c or b & d are definitive for juxtaposition of fragments X and Y, whereas PCR products from divergent primer pairs a & d are definitive for X–Y juxtaposition only if PCR controls, e.g., using convergent primer pairs b & j, e & i, f & h or g &c, are included to established cutting of DNA between fragments X and Y. PCR products from convergent primer pairs b & c are definitive for looping, but should be avoided because of potential to yield multiple PCR products and to deplete PCR reactions of primers and dNTP substrates.
Fig. 2
Fig. 2
Kinetics of restriction digestion of crosslinked chromatin using either EcoRI (panel A) or HindIII (panel B). The SAC3, BLM10, GAL10 and HEM3 genes are depicted on the left side, along with the positions of the EcoRI (E) or HindIII (H) restriction sites, along with primer pairs used for convergent PCR, drawn approximately to scale. The panels on the right show the kinetics of restriction digestion of chromatin DNA, processed according to our 3C protocol (without the ligation step). Following incubation with restriction enzyme for the indicated number of hours (hr) or overnight (O/N), digestion was monitored by PCR using the convergent primer pairs depicted in the panels on the left. Chr V is a PCR input control corresponding to an intergenic region of chromosome V. All primer pairs are defined in Supplemental Data, Table S1.
Fig. 3
Fig. 3. Mapping short range interactions
(A) General strategy for mapping juxtaposed regions in gene loops. As depicted here, 3C primer pairs are designed to detect juxtaposition of promoter (P) or terminator (T) regions with regions of the open reading frame (ORF), as well as upstream and downstream regions. The heavy arrows denote interactions detected by 3C for the BLM10 gene (panel C) and other genes (21, 22), whereas the dotted arrows denote 3C interactions that are not above background. (B) Schematic depiction of the BLM10 gene, depicting the positions of the HindIII sites (H) and 3C primer pairs (solid arrows). Spacing is drawn approximately to scale. (C) PCR products using the indicated primer pairs were fractionated in a 1.5% agarose gel and visualized by ethidium bromide staining using an AlphaImager 2000. Panels on the left represent 3C output analysis using the indicated concentrations of DNA template. Panels on the right correspond to PCR output from 3C control template DNA. Chr V denotes a non-transcribed region of chromosome V, generated using convergent primer pairs that are not separated by a HindIII restriction site. (D) Quantification of 3C PCR data from panel C, normalized to the 3C T1-UF PCR signal.

References

    1. Kornberg R. Angew Chem Int Ed Engl. 2007;46:6956–65. - PubMed
    1. Spector DL. Annu Rev Biochem. 2003;72:573–608. - PubMed
    1. Chambeyron S, Bickmore WA. Curr Opin Cell Biol. 2004;16:256–62. - PubMed
    1. Fraser P. Curr Opin Genet Dev. 2006;16:490–5. - PubMed
    1. Misteli T. Cell. 2007;128:787–800. - PubMed

Publication types

MeSH terms