. 2009 Jun;166(3):316-28.
doi: 10.1016/j.jsb.2009.02.014. Epub 2009 Mar 6.

3D imaging of diatoms with ion-abrasion scanning electron microscopy

Affiliations

3D imaging of diatoms with ion-abrasion scanning electron microscopy

Mark Hildebrand et al. J Struct Biol. 2009 Jun.

Abstract

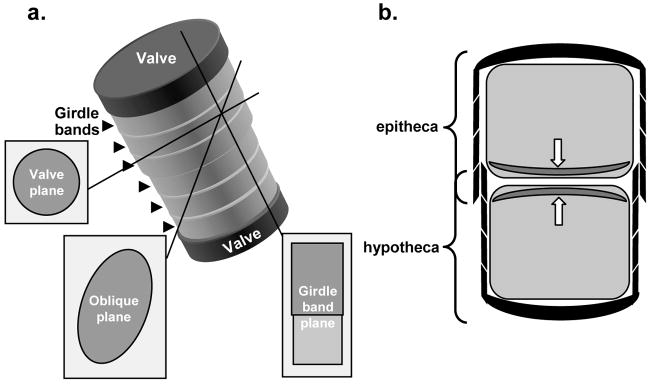
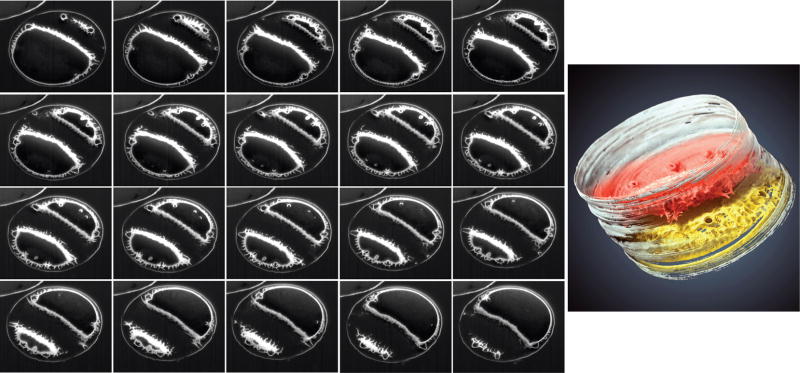
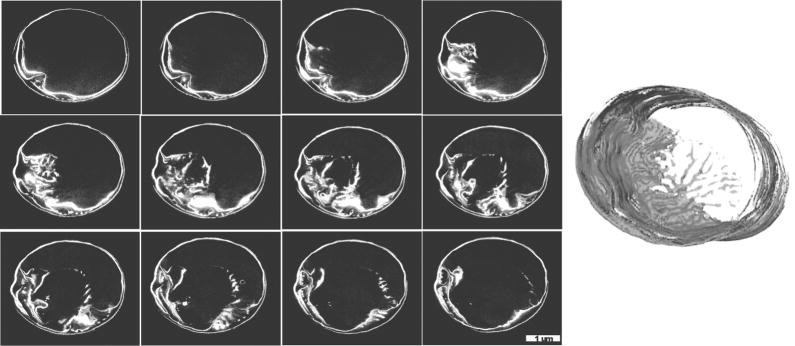
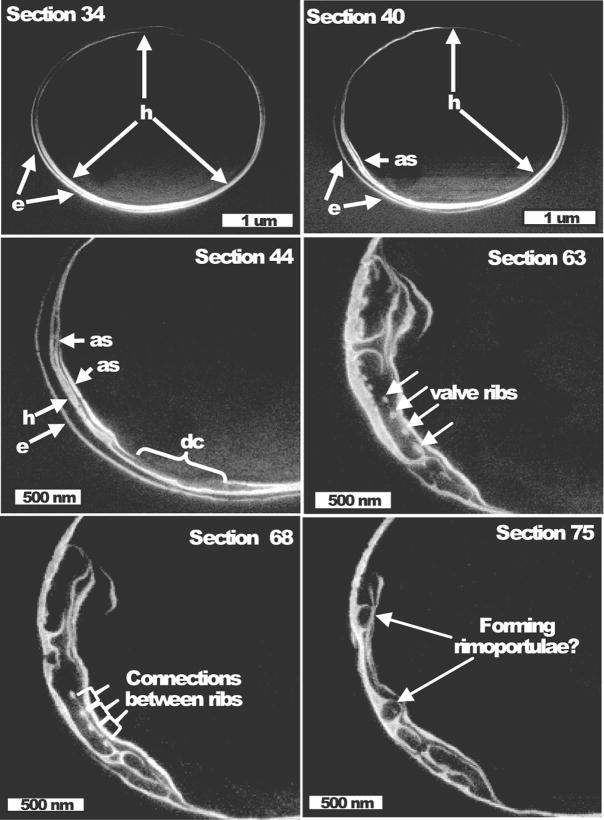
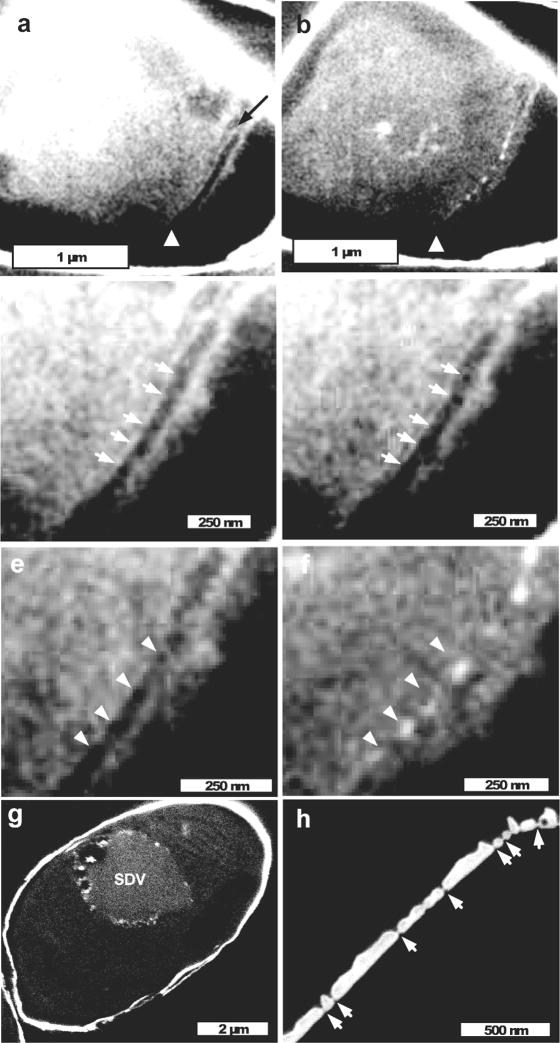
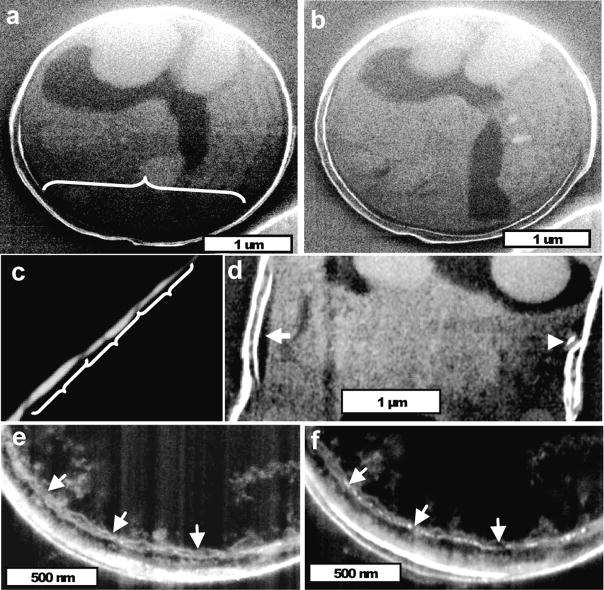
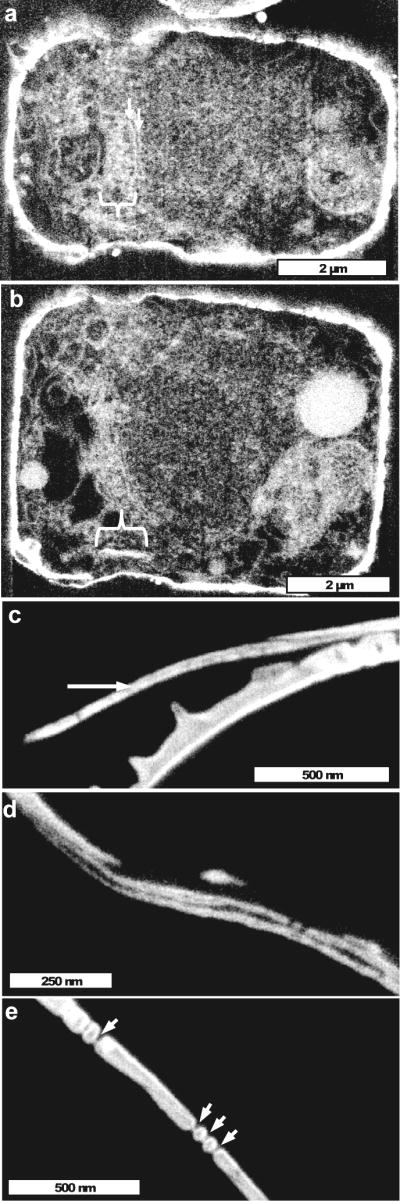
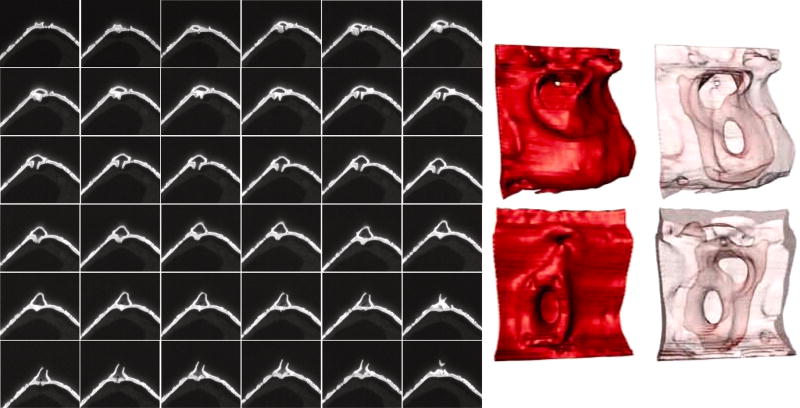
Ion-abrasion scanning electron microscopy (IASEM) takes advantage of focused ion beams to abrade thin sections from the surface of bulk specimens, coupled with SEM to image the surface of each section, enabling 3D reconstructions of subcellular architecture at approximately 30nm resolution. Here, we report the first application of IASEM for imaging a biomineralizing organism, the marine diatom Thalassiosira pseudonana. Diatoms have highly patterned silica-based cell wall structures that are unique models for the study and application of directed nanomaterials synthesis by biological systems. Our study provides new insights into the architecture and assembly principles of both the "hard" (siliceous) and "soft" (organic) components of the cell. From 3D reconstructions of developmentally synchronized diatoms captured at different stages, we show that both micro- and nanoscale siliceous structures can be visualized at specific stages in their formation. We show that not only are structures visualized in a whole-cell context, but demonstrate that fragile, early-stage structures are visible, and that this can be combined with elemental mapping in the exposed slice. We demonstrate that the 3D architectures of silica structures, and the cellular components that mediate their creation and positioning can be visualized simultaneously, providing new opportunities to study and manipulate mineral nanostructures in a genetically tractable system.


Figures

Figure 1
Figure 1
Organization of T. pseudonana cell features and views resulting from sectioning in different planes. (a) Schematic diagram of the exterior of a T. pseudonana cell. The valves are labeled at the top and bottom, and girdle bands are located by arrowheads at left. Views of sections through the cell in different planes are indicated. (b) Cross-sectional diagram of a T. pseudonana cell containing two daughter cell protoplasts. The epi- and hypo-theca are denoted by overlapping brackets. Inside each daughter cell protoplast, new valves have been formed (located by arrows), but these have not yet exocytosed to form the new cell wall.
Figure 2
Figure 2
Comparison of conventional SEM and ion-abrasion SEM imaging of T. pseudonana. (a and b) Surface imaging of T. pseudonana emphasizing (a) the entire cell structure, and (b) a close-up of the valve surface. (c and d) Cross-sectional images of T. pseudonana generated by ion-abrasion SEM. In both images silica surrounding the cell is highly electron bright and intracellular membranes are less bright. Numerous vacuoles are visible, and in (d), thylakoid membranes of the plastid are predominant. (e) Surface image of the proximal valve surface of T. pseudonana. Note the smooth but ribbed internal structure and inner projections of the rimoportulae. (f) 3D reconstruction of a series of images of the proximal valve surface of T. pseudonana generated by ion-abrasion SEM. Similar features are visible as in the surface image in (e).
Figure 3
Figure 3
Elemental map analysis of a section of T. pseudonana. Cross-sectional girdle band view of T. pseudonana with the corresponding (a) phosphorous, (b) oxygen, and (c) silicon elemental maps, overlaid on an SEM image (d). Differences in the field of view between the x-ray maps and the SEM image are due to the difference in the detector positions relative to the sample. As expected, silicon is concentrated within the cell walls. Phosphorous signals coincide with lipid-enriched portion of the cell. Oxygen signals are relatively high over the entire field of view but there are areas of enrichment, mainly along the cell wall
Figure 4
Figure 4
Imaging of newly formed valves in T. pseudonana just prior to cell separation. Left are images from a series of successive (left to right, up to down) sections (20 nm average depth) through a T. pseudonana cell that has completed both daughter cell valves but has not separated. The view is slightly offset from the true valve plane. The valves are seen in succession predominantly on the left initially, then on the right. Substructures such as the rimoportulae and the 20 nm pores and ribs on the valve surface are visible, indicating that images produced by ion-abrasion SEM have high fidelity. Right is a 3D reconstruction of the series, emphasizing the two interior valves, colored red and yellow.
Figure 5
Figure 5
Extremely early stage in T. pseudonana valve formation. Images are in valve plane. Left are images from successive (left to right, up to down) sections (20 nm average depth) indicating convoluted rib structure initially associated with the girdle band region in the lower left corner of the cell. Right is a 3D reconstruction confirming the association of the newly forming valve with the girdle band region, and the extended ribs.
Figure 6
Figure 6
Association of the forming valve with the girdle band region. Higher magnification images of sections from the same cell in Fig. 5. Section number of each image is denoted, individual sections were separated by 20 nm. Section 34 shows the epitheca (e), and hypotheca (h) girdle bands encircling the cell. Section 40 show an additional structure (as) associated with the hypotheca girdle band. Section 44 shows more complicated additional structures (as) and a discontinuity (dc) in structure. In section 63 valve ribs are visible (arrows) and in section 68 connections between the ribs are present (brackets). Circular structures in section 75 may be freshly forming rimoportulae.
Figure 7
Figure 7
Visualization of valve formation and the SDV, and cross-sectional structure of a completed valve. (a–f) are different sections from the same cell, imaged at an oblique angle from the girdle band plane. For all sections of this figure, more detail can be seen by zooming in. (a) Cross section of a cell just prior to initial visualization of silica. The dark band located by the white arrowhead is the SDV, and the dark arrow locates an adjacent filament with the width of actin (7 nm). (b) The next section towards the cell center from (a), which shows the first deposition of silica as ribs of the base layer. The dark opening characteristic of the SDV is missing in the location of the ribs, but is still present at the edges where rib silica is not visible (white arrowhead). (c and d) Successive cross-sections of the SDV prior to the appearance of silica. Arrows locate dark “holes” that are aligned in the successive sections, in reality, because the sectioning depth is 20 nm the dark areas are actually tubes oriented in the plane of the valve. (e and f) Another set of successive sections of the SDV, corresponding to those seen in (a and b). Arrows locate the dark holes in (e), which become filled with silica in (f). (g) Imaging of the SDV in an oblique cross-section of a cell. Association of the SDV predominantly with one side of the cell near the girdle bands is evident, as are circular outlines of fusing vesicles. (h) Cross-section of mature valve silica from the girdle band plane. The relatively flat proximal valve surface (towards the lower right) and ridged distal surface (towards the upper left) are evident, as are thin occlusions at the junction of the base and upper layer in the 20 nm pores (arrows) perforating the valve surface.
Figure 8
Figure 8
Visualization of the SDV and associated filaments during girdle band formation. (a) Valve plane section through a cell showing the dark area characteristic of the girdle band SDV (bracket) with some silica visible at left. (b) Another section of the same cell showing the presence of more silica in the girdle band SDV. (c) Cross-sectional image of a three overlapping girdle bands showing their tapered overlapping structure. (d) Girdle band plane view of a newly forming girdle band and associated SDV. Arrow at left denotes the dark area of the SDV, and arrowhead at right locates the forming girdle band on the other side of the cell. (e and f) Successive sections through a cell showing 7 nm filaments associated with a forming girdle band. In (f), the initial polymerization of silica (more highly electron dense material) can be seen.
Figure 9
Figure 9
Laminate structure of girdle bands. (a) Section in the girdle band plane near the cell wall showing an enrichment of organic material (bracket) of the correct width and at the correct location of a forming girdle band. Arrows denote filamentous material in a similar location as identified in Fig. 8. (b) Another section of the same cell as in (a), showing the precursor material of the girdle band in side view (bracket). (c) Cross-section of a girdle band showing the electron transparent central section (arrow) we interpret as being organic material. (d) Girdle band laminate structure in the process of separation. (e) Cross-sectional view of nanopores in girdle bands, which have a similar thin occlusion as was seen in the valve (Fig. 7h). The occlusion corresponds in position to the organic center of the girdle bands.
Figure 10
Figure 10
Structure of the rimoportula. Left is a series of image sections through a rimoportula (left to right, up to down), sectioning depth was 10 nm. Arrows in some of the images denote the location of accessory pores in the rimoportula chamber. Right is a 3D reconstruction of the portula highlighting the surface (red) or interior (pale pink) structure viewed from the outside (upper) and inside (lower) of the valve.
Figure 11
Figure 11
Central templating vs. confinement model for mesoscale structure formation. (a) TEM image of the silicification front during valve formation in T. pseudonana. Note the branched silica structure, and the location of regions where pores are forming, which lack silica. Image is in the same region as Fig. 3c in (Hildebrand et al., 2006), but is a distinct image. (b) Central templating model involving a linear protein (green) around which silica (gray) is deposited to form a rod structure. (c) Central templating model involving droplets of polyamines (blue) around which silica (gray) is deposited. In both models, the initial deposition of silica is concentrated around the template. (d) Confinement model of silicification. On left are depicted organic complexes comprising pores (in red) which flank a tubular structure (light blue) made of organics in the SDV lumen. Center depicts the initial stage of deposition, where silica is not yet confined, but forms a flat sheet within the tubule and between the pores. On the right, silica becomes concentrated in the tubule, and is less dense in the pore region. In this model, silica is initially not concentrated in one area, but becomes so over time.

Similar articles

Cited by

References

    1. Armbrust E, Berges J, Bowler C, Green B, Martinez D, Putnam N, Zhou S, Allen A, Apt K, Bechner M, Brzezinski M, Chaal B, Chiovitti A, Davis A, Demarest M, Detter J, Glavina T, Goodstein D, Hadi M, Hellsten U, Hildebrand M, Jenkins B, Jurka J, Kapitonov V, Kröger N, Lau W, Lane T, Larimer F, Lippmeier J, Lucas S, Medina M, Montsant A, Obornik M, Parker M, Palenik B, Pazour G, Richardson P, Rynearson T, Saito M, Schwartz D, Thamatrakoln K, Valentin K, Vardi A, Wilkerson F, Rokhsar D. The genome of the diatom Thalassiosira pseudonana: Ecology, evolution, and metabolism. Science. 2004;306:79–86. - PubMed
    1. Badour SS. Experimental separation of cell division and silica shell formation in Cyclotella cryptica. Archiv fur Mikrobiol. 1968;62:17–33.
    1. Bao ZH, Weatherspoon MR, Shian S, Cai Y, Graham PD, Allan SM, Ahmad G, Dickerson MB, Church BC, Kang ZT, Abernathy HW, Summers CJ, Liu ML, Sandhage KH. Chemical reduction of three-dimensional silica micro-assemblies into microporous silicon replicas. Nature. 2007;446:172–175. - PubMed
    1. Bright D. Lispix: An image processing and analysis tool for the PC. 2007. http://www.nist.gov/lispix/doc/contents.htm.
    1. Darley WM, Volcani BE. Role of silicon in diatom metabolism: A silicon requirement for deoxyribonucleic acid synthesis in the diatom Cylindrotheca fusiformis Reimann and Lewin. Exp Cell Res. 1969;58:334–342. - PubMed

Publication types

MeSH terms

LinkOut - more resources