

Comparison of quantitative imaging of cartilage for osteoarthritis: T2, T1rho, dGEMRIC and contrast-enhanced computed tomography
- PMID: 19269769
- PMCID: PMC2722506
- DOI: 10.1016/j.mri.2009.01.016
Comparison of quantitative imaging of cartilage for osteoarthritis: T2, T1rho, dGEMRIC and contrast-enhanced computed tomography
Abstract
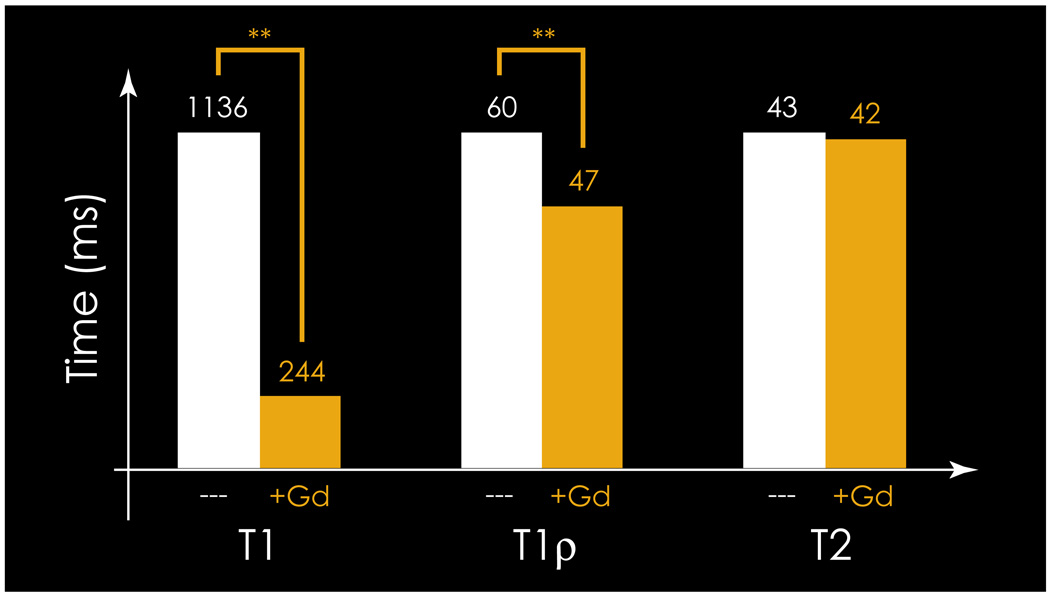
Evaluation of glycosaminoglycan (GAG) concentration in articular cartilage is of particular interest to the study of degenerative joint diseases such as osteoarthritis (OA). Noninvasive imaging techniques such as magnetic resonance imaging (MRI) and computed tomography (CT) have demonstrated the potential to assess biochemical markers of cartilage integrity such as GAG content; however, many imaging techniques are available and the optimization of particular techniques in the diagnosis of joint disease remains an active area of research. In order to highlight the differences between these various approaches, this work compares MRI (T1, T2 and T1rho) and contrast-enhanced CT in human articular cartilage, in both the presence and absence of gadolinium-based contrast agent. Pre- and postcontrast T2 values were found to be similar on a regional level and correlated with each other. As expected, T1 values were shortened significantly on both a global and a spatial basis in the presence of gadolinium (Gd); similar results were found for T1rho. T2 values were found to correlate mildly with postcontrast T1, T1(Gd) and with precontrast T1rho values. In addition, contrast-enhanced CT values correlated with both precontrast T1rho and T1(Gd) more strongly than with precontrast T2. Finally, T1(Gd) and precontrast T1rho were found to be moderately correlated with CT data. However, T1(Gd) and precontrast T1rho were found to be almost completely uncorrelated. Together, these results indicate that T1rho, T2 and contrast-enhanced techniques may provide complementary information about the molecular environment in cartilage during the evolution of OA.
Figures

References
-
- Altman R, Fries J, Bloch D. Radiographic assessment of progression in osteoarthritis. Arthritis Rheum. 1987;30:11. - PubMed
-
- Chan WP, et al. Osteoarthritis of the knee: comparison of radiography, CT, and MR imaging to assess extent and severity. Ajr Am J Roentgenol. 1991;157(4):799–806. - PubMed
-
- Dijkgraaf LC, et al. The structure biochemistry, and metabolism of osteoarthritic cartilage: a review of the literature. J Oral Maxillofac Surg. 1995;53(10):1182–1192. - PubMed
-
- Bashir A, et al. Glycosaminoglycan in articular cartilage: in vivo assessment with delayed Gd DTPA 2- -enhanced MR imaging. Radiology. 1997;2052:551–558. - PubMed
Publication types
MeSH terms
Substances
Grants and funding
LinkOut - more resources
Full Text Sources
Other Literature Sources
Medical
Research Materials
