Comparative Study
. 2009 May;75(9):2889-98.
doi: 10.1128/AEM.01640-08. Epub 2009 Mar 6.

Pyrosequencing of the chaperonin-60 universal target as a tool for determining microbial community composition

Affiliations
Comparative Study

Pyrosequencing of the chaperonin-60 universal target as a tool for determining microbial community composition

John Schellenberg et al. Appl Environ Microbiol. 2009 May.

Abstract

We compared dideoxy sequencing of cloned chaperonin-60 universal target (cpn60 UT) amplicons to pyrosequencing of amplicons derived from vaginal microbial communities. In samples pooled from a number of individuals, the pyrosequencing method produced a data set that included virtually all of the sequences that were found within the clone library and revealed an additional level of taxonomic richness. However, the relative abundances of the sequences were different in the two datasets. These observations were expanded and confirmed by the analysis of paired clone library and pyrosequencing datasets from vaginal swabs taken from four individuals. Both for individuals with a normal vaginal microbiota and for those with bacterial vaginosis, the pyrosequencing method revealed a large number of low-abundance taxa that were missed by the clone library approach. In addition, we showed that the pyrosequencing method generates a reproducible profile of microbial community structure in replicate amplifications from the same community. We also compared the taxonomic composition of a vaginal microbial community determined by pyrosequencing of 16S rRNA amplicons to that obtained using cpn60 universal primers. We found that the profiles generated by the two molecular targets were highly similar, with slight differences in the proportional representation of the taxa detected. However, the number of operational taxonomic units was significantly higher in the cpn60 data set, suggesting that the protein-encoding gene provides improved species resolution over the 16S rRNA target. These observations demonstrate that pyrosequencing of cpn60 UT amplicons provides a robust, reliable method for deep sequencing of microbial communities.


Figures
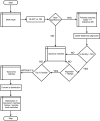
FIG. 1.
FIG. 1.
Data analysis flowchart of the watered-BLAST pipeline used to assign a taxonomic label for each sequence from the Sanger and GS FLX datasets.
FIG. 2.
FIG. 2.
Phylogenetic tree of sequences found in the Sanger data set generated from the 20-pool sample. The numbers in brackets after each sequence indicate the frequency with which each sequence is represented in the GS FLX data set compared to the Sanger data set, as described in the text (positive numbers indicate relatively greater frequency in the GS FLX data set). Sequences found only in the Sanger data set are indicated. The tree is a consensus of 100 neighbor-joined trees. Numbers at the nodes are bootstrap values out of 100. Sequences are labeled with their GenBank accession numbers.
FIG. 3.
FIG. 3.
Relative representation of bacterial families in the Sanger/pyrosequencing and total datasets for the 20-pool. The proportions of sequences representing each family were compared among the sequences found in both datasets (▪) and among the total data set (□).
FIG. 4.
FIG. 4.
Proportional representation of taxonomic categories in Sanger, Sanger overlap, (sequences in common to both datasets) and all sequences for each of four individuals. Individuals 001 and 006 were normal by microscopy, while individuals 027 and 054 were diagnosed with BV (Table 1).
FIG. 5.
FIG. 5.
Taxonomic composition of individual vaginal microbiota as determined by clone libraries and pyrosequencing. The taxonomic assignments of sequences found in the Sanger (A, C, E, and G) and GS FLX (B, D, F, and H) datasets are shown. For B, D, F, and H, additional taxa found in the GS FLX datasets are shown as stacked bar graphs, while the Sanger-overlap data set is shown as a pie chart. Colors are used to indicate bacterial families: yellow, Firmicutes; blue, Actinobacteria; red, Bacteroidetes; green, Proteobacteria. Species abbreviations: Lin, L. iners; Lcr, L. crispatus; L6, Lactobacillus sp. strain L6; Lje, L. jensenii; Pbu, P. buccalis; Gva, G. vaginalis; N156, Nairobi isolate 156 (Actinobacteria spp.); Afa, Acidovorax facilis; Pme, P. melaninogenica; Ava, A. vaginae; Mel, Megasphaera eldensii; Pin, P. intermedia; N137, Nairobi isolate 137 (Actinobacteria spp.); N160, Nairobi isolate 160 (Actionobacteria spp.); Lsa, Lactobacillus salivarius; Fma, Finegoldia magna; Tca, Thermosinus carboxydivorans.
FIG. 6.
FIG. 6.
Relative abundances of genera and species found in the technical replicates of individual 166 (A) and in the cpn60 and 16S rRNA GS FLX datasets for the four individuals pooled (B). For panel B, the shaded area represents the maximum observed variability expected from technical replicates of the same sample (A). Abbreviations: N137, Actinobacteria sp. strain N137; N156. Actinobacteria sp. strain N156; N160, Actinobacteria sp. strain N160; Gva, G. vaginalis; Ava, A. vaginae; Bov, Bacteroides ovatus; Mhy, Megamonas hypermegale; Pgi, Porphyromonas gingivalis; Pbi, Prevotella bivia; Pbu, P. buccalis; Pco, P. corporis; Pdi, P. disiens; Pin, P. intermedia; Pme, P. melaninogenica; Por, P. oralis; Pru, P. ruminocola; Prevotella sp., all Prevotella species; Fma, Finegoldia magna; Mel, Megasphaera elsdenii; Tca, Thermosinus carboxydivorans; Afa, Acidovorax facilis; Lcr, Lactobacillus crispatus; Lga, L. gasseri; Lin, L. iners; Lre, L. reuteri; Lsa, L. salivarius; Lactobacillus sp., all Lactobacillus species; Ssa, Streptococcus salivarius.
FIG. 7.
FIG. 7.
Calculation of the number of OTUs for each of the 16S rRNA and cpn60 GS FLX subsets identified as Prevotella spp. The number of OTUs calculated by the farthest-neighbor algorithm of DOTUR are reported at various sampling depths for percent identity cutoffs of 3% (cpn60, ▪; 16S rRNA, □) and 5% (cpn60, ░⃞; 16S rRNA, ▧). Error bars represent 95% confidence intervals.

References

    1. Altschul, S. F., T. L. Madden, A. A. Schaffer, J. Zhang, Z. Zhang, W. Miller, and D. J. Lipman. 1997. Gapped BLAST and PSI-BLAST: a new generation of protein database search programs. Nucleic Acids Res. 25:3389-3402. - PMC - PubMed
    1. Chou, H. H., and M. H. Holmes. 2001. DNA sequence quality trimming and vector removal. Bioinformatics 17:1093-1104. - PubMed
    1. Dethlefsen, L., M. McFall-Ngai, and D. A. Relman. 2007. An ecological and evolutionary perspective on human-microbe mutualism and disease. Nature 449:811-818. - PMC - PubMed
    1. Dumonceaux, T. J., J. E. Hill, S. M. Hemmingsen, and A. G. Van Kessel. 2006. Characterization of intestinal microbiota and response to dietary virginiamycin supplementation in the broiler chicken. Appl. Environ. Microbiol. 72:2815-2823. - PMC - PubMed
    1. Edwards, R. A., B. Rodriguez-Brito, L. Wegley, M. Haynes, M. Breitbart, D. M. Peterson, M. O. Saar, S. Alexander, E. C. Alexander, Jr., and F. Rohwer. 2006. Using pyrosequencing to shed light on deep mine microbial ecology. BMC Genomics 7:57. - PMC - PubMed