. 2009 Mar 1;23(5):589-601.
doi: 10.1101/gad.511809.

Chromatin state marks cell-type- and gender-specific replication of the Drosophila genome

Affiliations

Chromatin state marks cell-type- and gender-specific replication of the Drosophila genome

Michaela Schwaiger et al. Genes Dev. .

Abstract

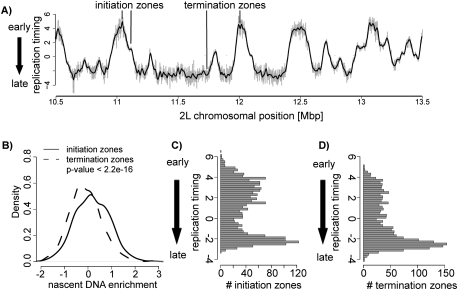
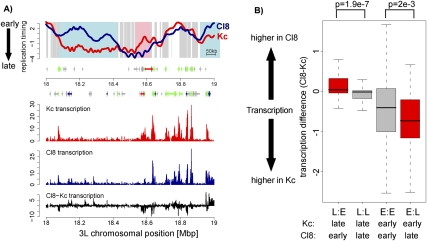
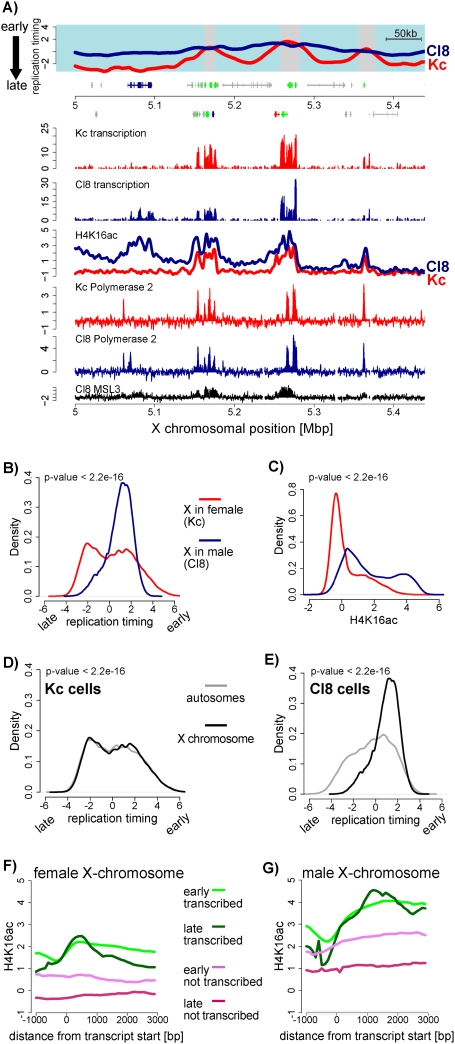
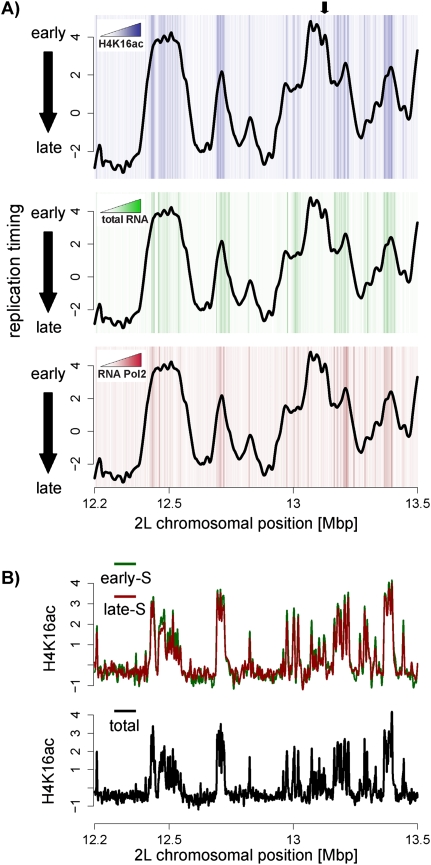
Duplication of eukaryotic genomes during S phase is coordinated in space and time. In order to identify zones of initiation and cell-type- as well as gender-specific plasticity of DNA replication, we profiled replication timing, histone acetylation, and transcription throughout the Drosophila genome. We observed two waves of replication initiation with many distinct zones firing in early-S phase and multiple, less defined peaks at the end of S phase, suggesting that initiation becomes more promiscuous in late-S phase. A comparison of different cell types revealed widespread plasticity of replication timing on autosomes. Most occur in large regions, but only half coincide with local differences in transcription. In contrast to confined autosomal differences, a global shift in replication timing occurs throughout the single male X chromosome. Unlike in females, the dosage-compensated X chromosome replicates almost exclusively early. This difference occurs at sites that are not transcriptionally hyperactivated, but show increased acetylation of Lys 16 of histone H4 (H4K16ac). This suggests a transcription-independent, yet chromosome-wide process related to chromatin. Importantly, H4K16ac is also enriched at initiation zones as well as early replicating regions on autosomes during S phase. Together, our study reveals novel organizational principles of DNA replication of the Drosophila genome and suggests that H4K16ac is more closely correlated with replication timing than is transcription.


Figures

Figure 1.
Figure 1.
High-resolution replication timing analysis in Drosophila cells. (A) DNA content profile of Kc cells. The FACS sorting-gates for early-, mid-, and late-S phase are indicated. The X-axis denotes DNA content and the Y-axis cell count. (B) Enrichments of BrdU-containing DNA in each sorted fraction as quantified by qPCR. Four genes and a pericentric repeat sequence are shown that replicate at different times. As expected, the heterochromatic repeat replicated later than all tested genes. Note that in all genes the relative replication timing can be correctly inferred from measuring only the early and late fraction by using qPCR (bar graphs) or microarrays [log2 (early/late) array]. This is also the case for mid-replicating sequences such as CG9743. Error bars represent the standard deviations between biological repeats. (C) Graphical illustration of the broad distribution of replication timing patterns over the sorted regions allowing us to obtain continuous timing information by considering the early and late fractions. (D) Analysis of 25 single-gene controls quantified by qPCR compared with microarray measurements. Both methods show strong correlation (r = 0.95) reflecting high accuracy of array measurements.
Figure 2.
Figure 2.
Distribution of zones of replication initiation and replication fork termination. (A) Shown are the replication timing values for a representative region of chromosome 2L in Kc cells. Initiation zones manifest as peaks, and regions of fork termination as valleys. Several of these are indicated on this profile. Individual dots represent raw replication timing values and the black line represents the loess-smoothed replication timing profile. The Y-axis denotes the replication timing ratio and the X-axis the chromosomal position in base pairs. (B) Initiation zones are enriched for small nascent strand DNA. Shown is a density plot comparing enrichments of small nascent strands in timing-defined initiation versus termination zones. This analysis shows that initiation zones are enriched in small nascent DNA compared with termination zones (P < 2.2e-16). The P-value was calculated using the Wilcoxon rank-sum test. (C) Histogram displaying the frequency of timing-defined initiation zones throughout S phase, which reveals reduced initiation events in mid-S phase. (D) Histogram displaying the frequency of timing-defined termination zones throughout S phase, revealing increased fork convergence events toward late-S phase.
Figure 3.
Figure 3.
Differences in replication timing correlate frequently with transcription differences. (A) Replication timing profiles of Kc (red) and Cl8 (blue) cells for a representative region on chromosome 3L. The X-axis is the 3L chromosomal position in megabase pairs, the Y-axis log2 (early/late replication). Background coloring denotes regions that replicate earlier in Cl8 cells (L:E, blue), regions that replicate earlier in Kc cells (E:L, pink), and regions replicating similarly in both cell types (gray). Regions with small differences over short regions were not included in further analysis (white, see methods for details). Annotated genes are displayed below the profile ([boxes] exons, [lines] introns, [small boxes] UTRs) and colored by their expression status (based on Affymetrix expression arrays; see the Supplemental Material; [green] expressed in Kc and Cl8 cells, [blue] expressed only in Cl8 cells, [red] expressed only in Kc cells, [gray] not expressed in Kc and Cl8 cells). Transcription levels of Kc (red) and Cl8 (blue) cells measured by Affymetrix tiling arrays are displayed on the same scale below, including transcription level differences (black). (B) Distribution of transcription differences for regions with differential replication timing on autosomes. The boxplots illustrate that on average differences in replication timing coincide with changes in transcription. Transcriptional differences are calculated within HMM defined regions of differential replication timing and calculated as transcription Cl8 minus transcription Kc (log2). (L:E) Regions replicating earlier in Cl8 cells; (L:L) regions replicating late in both cell types; (E:E) regions replicating early in both cell types; (E:L) regions replicating earlier in Kc cells. P-values were calculated using the Wilcoxon rank-sum test.
Figure 4.
Figure 4.
Early replication timing of the male X chromosome. (A) Replication timing and transcription of a representative region on the X. Cl8 is shown in blue and Kc is shown in red (similar to Fig. 3A). In addition, H4K16ac and RNA polymerase II profiles are displayed for Kc (red line) and Cl8 (blue line) cells (Affymetrix tiling arrays). Previously published MSL3 binding data in Cl8 cells (Alekseyenko et al. 2006) are shown in black. (B) Quantitative comparison of replication timing between male and female X chromosomes. Shown is the frequency of array probes for any given replication timing value (X-axis) separately for the X in male (Cl8, blue line) and for the X in female (Kc, red line). This density plot shows that most of the male X replicates early (above zero), while the female X replicates similarly to autosomes. (C) Comparison of H4K16 acetylation for all X-linked array probes similar to B. This density plot shows that the male X is strongly enriched for H4K16 acetylation. (D,E) Density plot of replication timing on the X chromosome versus autosomes in female Kc cells (D) and in male Cl8 cells (E). P-values were calculated using the Wilcoxon rank-sum test. (F) Average signal for H4K16ac in Kc cells at genes. Genes were grouped according to replication timing and transcriptional activity into “active, early replicating,” (green line), “active, late replicating,” (dark-green line), “inactive, early replicating,” (violet line), and “inactive, late replicating” (red line). Genes were aligned at their start sites, and signals were averaged (see the Supplemental Material). (G) Similar analysis as in F for male cells (Cl8). Note that the male X chromosome contains higher H4K16 acetylation signals throughout active genes, but also in the gene body of early replicating nontranscribed genes.
Figure 5.
Figure 5.
H4K16ac is enriched at initiation zones on autosomes. (A) Shown is a Kc replication timing profile (line) with a heat map illustrating H4K16 acetylation (top graph), transcription (middle graph), or RNA Polymerase II (bottom graph) in the background. This reveals the presence of H4K16ac at sites of initiation, some of which are not transcribed. White indicates absence of enrichments, and darker colors indicate higher levels. The black arrow marks a region of replication initiation with high H4K16ac, but not RNA or Polymerase II levels. Quantification of these heat map data is provided in Supplemental Figure 10B–D. (B) Profiles of H4K16ac generated from cells that are in early-S phase (green) or late-S phase (red). These patterns are almost identical to the pattern generated from unsorted cells (black line) indicating that H4K16 acetylation levels are not S-phase-specific.

References

    1. Aggarwal B.D., Calvi B.R. Chromatin regulates origin activity in Drosophila follicle cells. Nature. 2004;430:372–376. - PubMed
    1. Aladjem M.I. Replication in context: Dynamic regulation of DNA replication patterns in metazoans. Nat. Rev. Genet. 2007;8:588–600. - PubMed
    1. Aladjem M.I., Rodewald L.W., Kolman J.L., Wahl G.M. Genetic dissection of a mammalian replicator in the human β-globin locus. Science. 1998;281:1005–1009. - PubMed
    1. Alekseyenko A.A., Larschan E., Lai W.R., Park P.J., Kuroda M.I. High-resolution ChIP–chip analysis reveals that the Drosophila MSL complex selectively identifies active genes on the male X chromosome. Genes & Dev. 2006;20:848–857. - PMC - PubMed
    1. Anglana M., Apiou F., Bensimon A., Debatisse M. Dynamics of DNA replication in mammalian somatic cells: Nucleotide pool modulates origin choice and interorigin spacing. Cell. 2003;114:385–394. - PubMed

Publication types