. 2009 Mar 1;23(5):633-42.
doi: 10.1101/gad.1762309.

Integration target site selection by a resurrected human endogenous retrovirus

Affiliations

Integration target site selection by a resurrected human endogenous retrovirus

Troy Brady et al. Genes Dev. .

Abstract

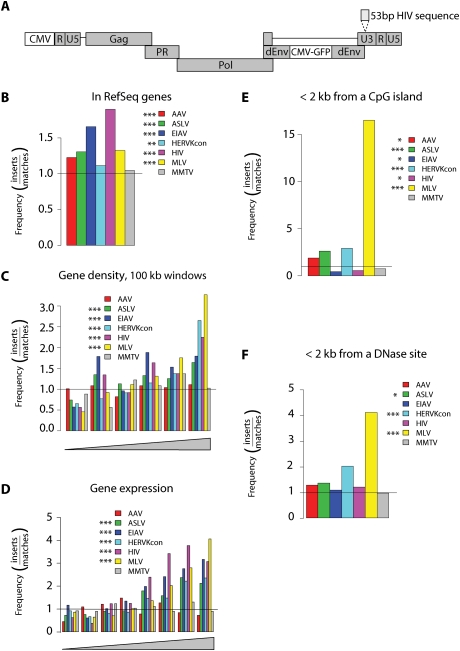
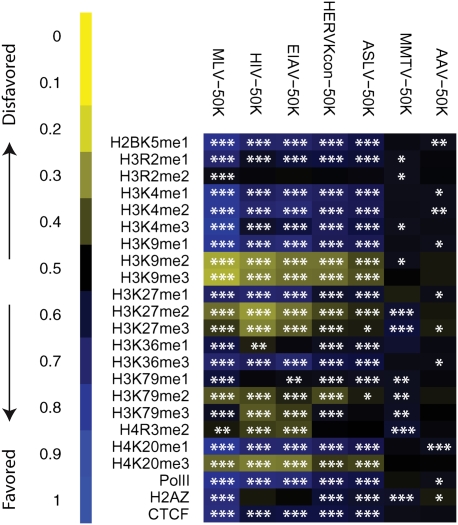
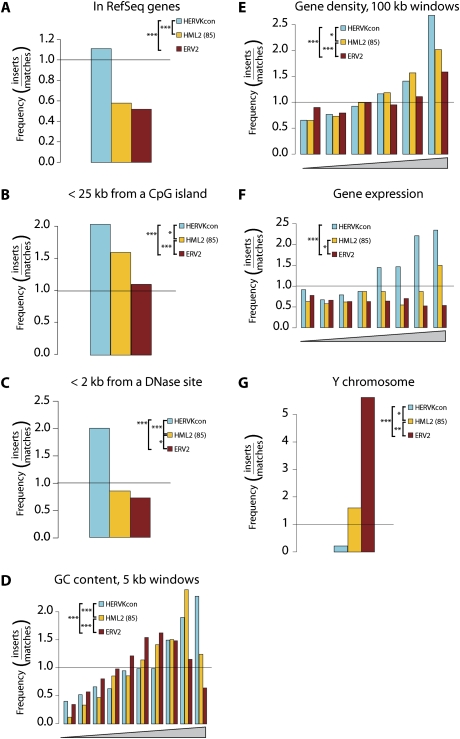
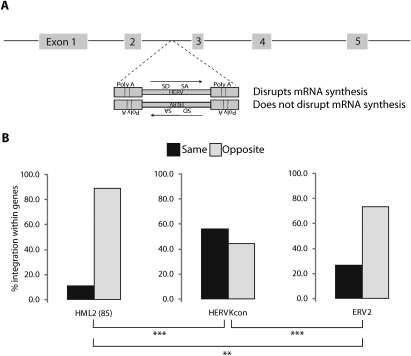
At least 8% of the human genome was formed by integration of retroviral DNA sequences. Here we analyze the forces directing the accumulation of human endogenous retroviruses (HERVs) by comparing de novo HERV integration targeting with the distribution of fixed HERV elements in the human genome. All known genomic HERVs are inactive due to mutation, but we were able to study integration targeting using a reconstituted consensus HERV-K (designated HERV-K(Con)). We found that HERV-K(Con) integrated preferentially in transcription units, in gene-rich regions, and near features associated with active transcription units and associated regulatory regions. In contrast, genomic HERV-K proviruses are found preferentially outside transcription units. The minority of genomic HERVKs present inside transcription units are in opposite transcriptional orientation relative to the host gene, the orientation predicted to be minimally disruptive to host mRNA synthesis, but de novo HERV-K(Con) integration within transcription units showed no orientation bias. We also found that the youngest HERV-K elements in the human genome showed a distribution intermediate between de novo HERV-K(Con) integration sites and older fixed HERV-Ks. These findings indicate that accumulation of HERVs in the human germline is a two-step process: integration targeting biases direct initial accumulation, then purifying selection leads to loss of proviruses disrupting gene function.


Figures

Figure 1.
Figure 1.
Integration target site selection of HERVKcon compared with other retroviruses. (A) Diagram of the modified HERVKcon used for integration targeting studies showing the insertion of a DNA tag in the U3 region of the 3′ LTR. For B–F, values are reported as the proportion of integration events divided by random events. The bar at 1.0 represents the expected random distribution. The statistical significance of differences from the matched random controls is shown by the asterisks next to the legends. (*) 0.05 > P > 0.01; (**) 0.01 > P > 0.001; (***) P < 0.001. (B) Integration frequency within RefSeq genes. (C) Integration frequency as a function of gene density. The X-axis shows six bins of increasing gene density from lowest (left) to highest (right). (D) Integration frequency relative to gene expression. All genes tested in 293T cells using the Affymetrix 133 array were divided into eight equal bins, then the proportions of integration sites in genes at each activity level were quantified and compared with random. The X-axis shows bins of increasing expression rank from lowest (left) to highest (right). (E) Integration frequency relative to CpG islands, scored as the proportion of integration sites within 2 kb of an annotated CpG island. (F) Integration frequency relative to sites of DNase I cleavage (Crawford et al. 2004), scored as the proportion of integration sites within 2 kb of an annotated cleavage site.
Figure 2.
Figure 2.
Integration frequency near sites of epigenetic modification and bound chromosomal proteins. Associations of integration with histone methylation and chromatin-bound proteins were quantified using ROC curve areas (Berry et al. 2006). In each case, the association of the experimental integration site data set was compared with the frequency in the matched random controls. Negative correlations between the genomewide annotation and integration frequency are shown by shades of yellow, with increasing intensity indicating stronger effects. Positive correlations are shown similarly but colored blue. Statistical tests for significant differences in distribution compared with the matched random control are summarized by asterisks on each tile of the heat map: (*) 0.05 > P > 0.01; (**) 0.01 > P > 0.001; (***) P < 0.001. The data on epigenetic modifications and bound proteins was from Barski et al. (2007). The viruses studied are marked above each column. CTCF is a DNA-binding protein proposed to be associated with chromatin boundaries, H2AZ a histone variant associated with promoters.
Figure 3.
Figure 3.
Integration of HERVKcon versus resident ERV2 elements. Values are reported as the proportion of integration events divided by random events. The bar at 1.0 represents the expected random distribution. The statistical significance of differences between data sets is shown by the asterisks next to the legends: (*) 0.05 > P > 0.01; (**) 0.01 > P > 0.001; (***) P < 0.001. (A) Integration frequency relative to transcription units as defined by the RefSeq database. (B) Integration frequency relative to CpG islands. (C) Integration frequency relative to DNAse I cleavage sites, 2-kb windows. (D) Integration frequency relative to G/C content, 5-kb windows. (E) Integration frequency relative to gene density. (F) Integration frequency relative to gene activity. In this plot, Affymetrix microarray analysis was used to rank the activity of all genes queried, then the ranks were distributed into eight bins. The genes hosting integration events were then distributed into the bins and the frequencies compared with matched random controls. (G) Integration site distribution on the Y chromosome. Only the HT1080 data set was used in this analysis, since it is from a male cell line.
Figure 4.
Figure 4.
Proviral orientations for newly integrated HERVKcon versus resident HERVs. (A) Diagram showing proviral orientations and the potential for transcriptional disruption by provirus-encoded transcription signals. (SD) Splice donor; (SA) splice acceptor; (PolyA) polyA signal. (B) Transcriptional orientation of ERV2, HML2(85), and HERVKcon sequences found within gene-coding regions as defined by the RefSeq database.

References

    1. Aiuti A., Cassani B., Andolfi G., Mirolo M., Biasco L., Recchia A., Urbinati F., Valacca C., Scaramuzza S., Cazzola M., et al. Multilineage hematopoietic reconstitution without clonal selection in ADA-SCID patients treated with stem cell gene therapy. J. Clin. Invest. 2007;117:2233–2240. - PMC - PubMed
    1. Bannert N., Kurth R. Retroelements and the human genome: New perspectives on an old relation. Proc. Natl. Acad. Sci. 2004;101:14572–14579. - PMC - PubMed
    1. Barbulescu M., Turner G., Seaman M.I., Deinard A.S., Kidd K.K., Lenz J. Many human endogenous retrovirus K (HERV-K) proviruses are unique to humans. Curr. Biol. 1999;26:861–868. - PubMed
    1. Barr S.D., Leipzig J., Shinn P., Ecker J.R., Bushman F.D. Integration targeting by avian sarcoma-leukosis virus and human immunodeficiency virus in the chicken genome. J. Virol. 2005;79:12035–12044. - PMC - PubMed
    1. Barski A., Cuddapah S., Cui K., Roh T.Y., Schones D.E., Wang Z., Wei G., Chepelev I., Zhao K. High-resolution profiling of histone methylations in the human genome. Cell. 2007;129:823–837. - PubMed

Publication types

LinkOut - more resources