

Expression quantitative trait loci mapping with multivariate sparse partial least squares regression
- PMID: 19270271
- PMCID: PMC2674843
- DOI: 10.1534/genetics.109.100362
Expression quantitative trait loci mapping with multivariate sparse partial least squares regression
Abstract
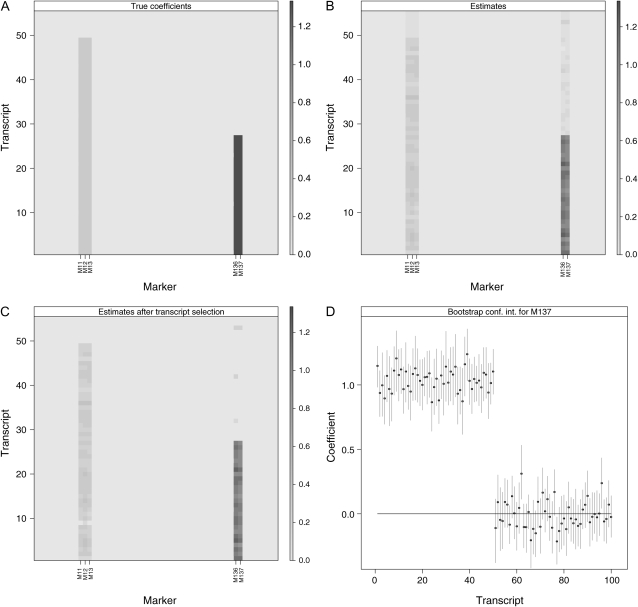
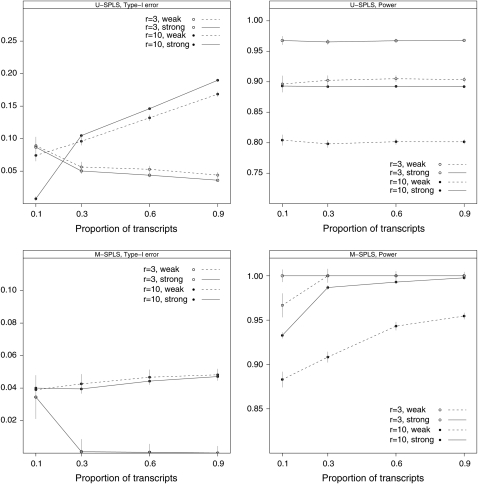
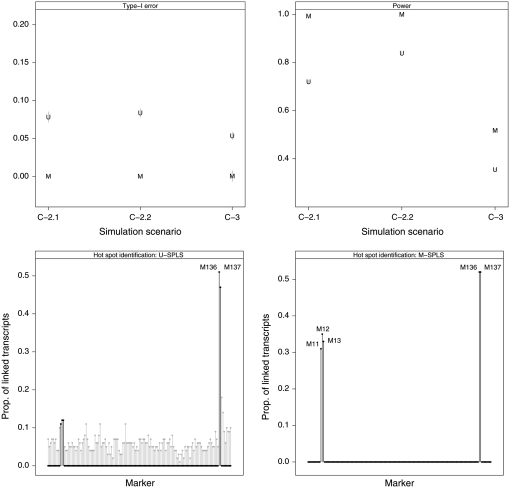
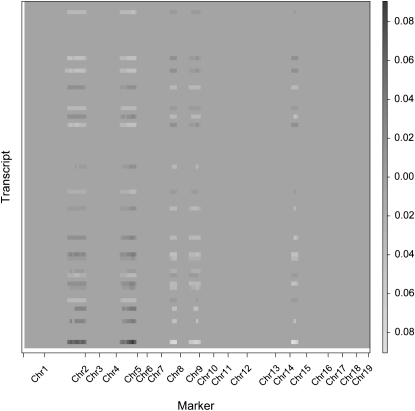
Expression quantitative trait loci (eQTL) mapping concerns finding genomic variation to elucidate variation of expression traits. This problem poses significant challenges due to high dimensionality of both the gene expression and the genomic marker data. We propose a multivariate response regression approach with simultaneous variable selection and dimension reduction for the eQTL mapping problem. Transcripts with similar expression are clustered into groups, and their expression profiles are viewed as a multivariate response. Then, we employ our recently developed sparse partial least-squares regression methodology to select markers associated with each cluster of genes. We demonstrate with extensive simulations that our eQTL mapping with multivariate response sparse partial least-squares regression (M-SPLS eQTL) method overcomes the issue of multiple transcript- or marker-specific analyses, thereby avoiding potential elevation of type I error. Additionally, joint analysis of multiple transcripts by multivariate response regression increases power for detecting weak linkages. We illustrate that M-SPLS eQTL compares competitively with other approaches and has a number of significant advantages, including the ability to handle highly correlated genotype data and computational efficiency. We provide an application of this methodology to a mouse data set concerning obesity and diabetes.
Figures
References
-
- Bair, E., T. Hastie, D. Paul and R. Tibshirani, 2006. Prediction by supervised principal components. J. Am. Stat. Assoc. 101 119–137.
-
- Brem, R. B., G. Yvert, R. Clinton and L. Kruglyak, 2002. Genetic dissection of transcriptional regulation in budding yeast. Science 296 752–755. - PubMed
Publication types
MeSH terms
Substances
Grants and funding
LinkOut - more resources
Full Text Sources
Medical
