. 2009 May 1;284(18):12562-71.
doi: 10.1074/jbc.M901121200. Epub 2009 Mar 6.

Inverse regulation of plasticity-related immediate early genes by calcineurin in hippocampal neurons

Affiliations

Inverse regulation of plasticity-related immediate early genes by calcineurin in hippocampal neurons

Brian Yee Hong Lam et al. J Biol Chem. .

Abstract

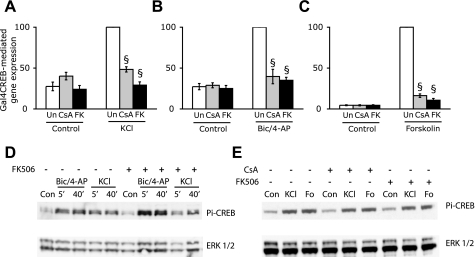
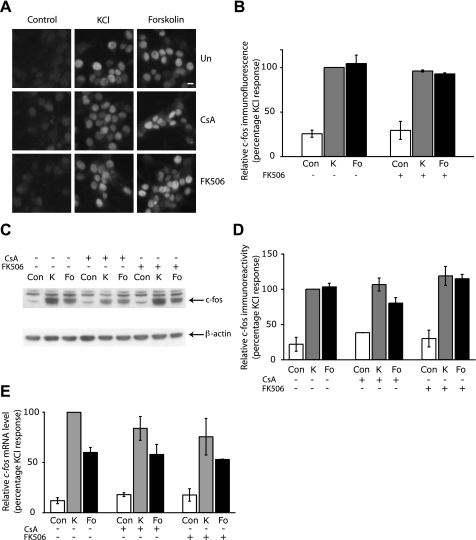
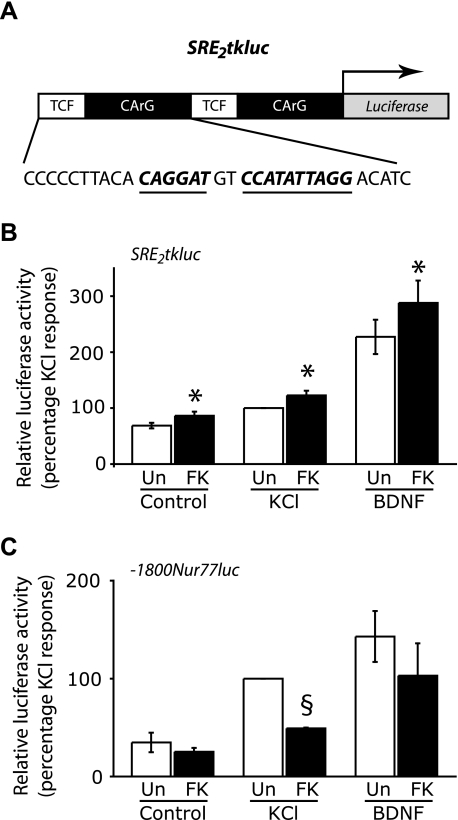
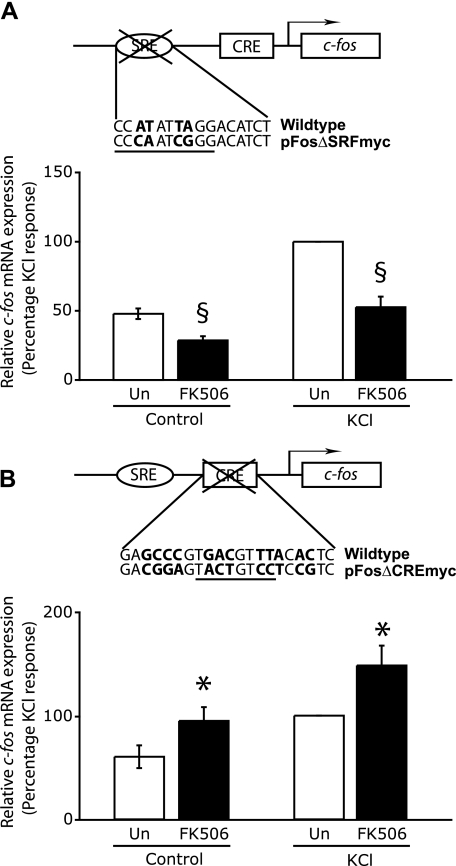
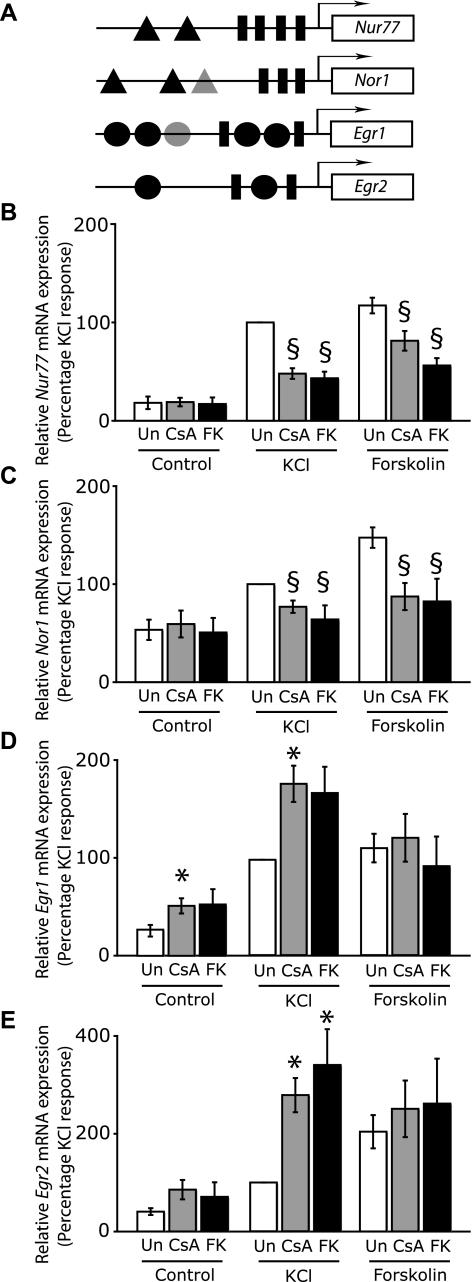
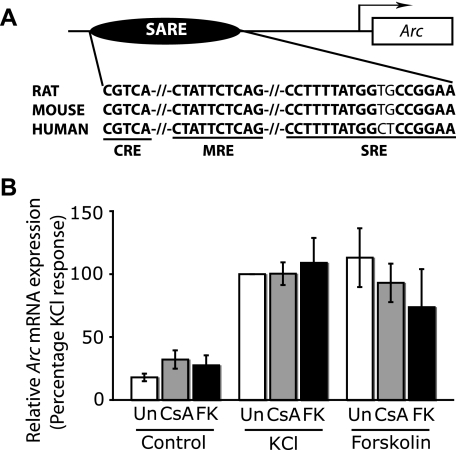
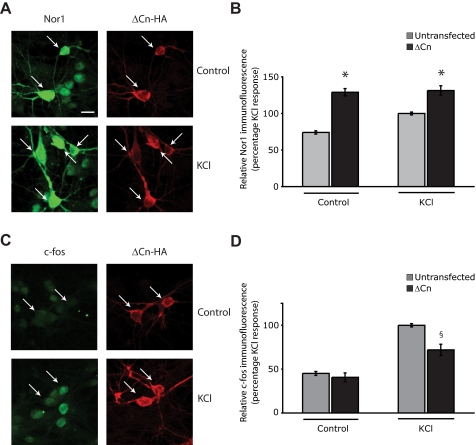
In the mammalian hippocampus, changes in the expression of immediate early genes (IEGs) is thought to contribute to long term plastic changes in neurons brought about by learning tasks and high frequency stimulation of synapses. The phosphatase calcineurin has emerged as an important negative regulator of hippocampus-dependent learning and long term potentiation. Here we investigated the possibility that the constraining action of calcineurin on hippocampal plasticity is mediated in part by regulation of gene expression through negative control of transcription factors, such as cAMP-response element (CRE)-binding protein (CREB). We assessed the effect of calcineurin inhibitors on CREB activation by neuronal activity and show that calcineurin activity is in fact required for CREB-mediated gene expression. However, inhibition of calcineurin had disparate effects on the transcriptional induction of CREB-dependent IEGs. We find that the IEG c-fos is unaffected by suppression of calcineurin activity, the plasticity-related genes Egr1/Zif268 and Egr2/Krox-20 are up-regulated, and genes encoding the orphan nuclear hormone receptors Nor1 and Nur77 are down-regulated. We further show that the up-regulation of particular IEGs is probably due to the presence of serum response elements (SREs) in their promoters, because SRE-mediated gene expression is enhanced by calcineurin blockers. Moreover, expression of the c-fos gene, which is unaffected by calcineurin inhibitors, could be down-regulated by mutating the SRE. Conversely, SRE-mediated c-fos induction in the absence of a functional CRE was enhanced by calcineurin inhibitors. Our experiments thus implicate calcineurin as a negative regulator of SRE-dependent neuronal genes.


Figures

FIGURE 1.
FIGURE 1.
Calcineurin inhibitors attenuate CREB-mediated gene expression via a phospho-CREB independent mechanism. Inhibition of calcineurin activity by CsA or FK506 diminishes CREB-mediated gene transcription in neurons stimulated with 40 mm KCl (A), 50 μm bicuculline and 2.5 mm 4-aminopyridine (Bic/4-AP) (B), or 10 μm forskolin (C). Hippocampal neurons cultured in 12-well plates were co-transfected with 1 μg of Gal4CREB, 0.5 μg of 5×Gal4-E1bluc, and 0.1 μg of pRL-TK. 36 h after transfection, cells were pretreated for 15 min with 1 μm CsA or 0.1 μm FK506 or left untreated (Un), followed by stimulation with KCl, forskolin, or Bic/4-AP for 6 h. Firefly luciferase activity was measured and normalized to the Renilla luciferase signal. Data are from three independent transfection experiments and are shown as mean ± S.E. §, significant reduction of luciferase activity in CsA- and FK506-treated cells compared with that in the corresponding stimulation in the absence of calcineurin inhibitors; p < 0.05 (Student's t test). D, FK506 does not affect the kinetics of CREB phosphorylation on serine 133 (Pi-CREB) induced by Bic/4-AP or 50 mm KCl (KCl). Neurons were stimulated with either Bic/4-AP or KCl for 5 min or 40 min in the presence or absence of 0.1 μm FK506 and processed for immunoblotting using an antibody that recognizes CREB phosphorylated on serine 133 (top). Blots were then stripped and probed with an antibody toward extracellular signal-regulated kinase (ERK1/2)(bottom). E, CsA and FK506 do not affect CREB phosphorylation induced by 50 mm KCl or 10 μm forskolin (Fo) Neurons were pretreated for 15 min with either 1 μm CsA or 0.1 μm FK506 or left untreated followed by stimulation for 40 min with 50 mm KCl or 10 μm forskolin and processed for immunoblotting as described for D above.
FIGURE 2.
FIGURE 2.
Expression of c-fos is not affected by the suppression of calcineurin activity. A, representative example of hippocampal neurons showing nuclear c-Fos protein expression in cells pretreated with 1 μm CSA or 0.1 μm FK506 or left untreated (Un) for 15 min followed by stimulation with 50 mm KCl or 10 μm forskolin for 2 h. Scale bar, 10 μm. B, a graph showing the average level of c-Fos immunofluorescence in untreated cells (Con) or cells treated with 50 mm KCl (K) or 10 μm forskolin (Fo) for 2 h, with or without 0.1 μm FK506 pretreatment. Over 50 cells of each treatment from three independent experiments were analyzed. Values are shown as mean ± S.E. C, Western blot showing that the induction of c-Fos protein by 50 mm KCl (K) and 10 μm forskolin (Fo) is not changed by a 15-min pretreatment with either 1 μm CSA or 0.1 μm FK506. Neurons were stimulated for 2 h and processed for c-Fos immunoblotting (top). Immunoblots were stripped and probed with an antibody to β-actin (bottom). D, quantitative analyses of c-Fos protein levels from immunoblots is shown in the graph. The c-Fos and β-actin immunoreactivity was measured using Image J, and c-Fos levels were normalized to that of β-actin. Values are shown as mean ± S.E., and data are from three independent experiments. E, qPCR revealed that the induction of c-fos mRNA expression by 50 mm KCl (K) or 10 μm forskolin (Fo) in neurons stimulated for 50 min was unaffected by a 15-min pretreatment with either 1 μm CSA or 0.1 μm FK506. Values are represented as mean ± S.E., and data are from five independent experiments.
FIGURE 3.
FIGURE 3.
Inhibition of calcineurin enhances SRE-mediated gene expression but reduces expression of a Nur77 reporter gene driven by CREs and MREs. A, the promoter organization of the SRE2tkluc plasmid used in this experiment. The firefly luciferase reporter gene is driven by two repeats of the c-fos SRE, each comprising a TCF binding site and an SRF binding site (CArG). The TCF binding site and the CArG box are depicted in boldface type and are also underlined. B, SRE-mediated gene expression is enhanced by FK506. Hippocampal neurons cultured in 12-well plates were co-transfected with 0.1 μg of pRL-TK and 0.5 μg of SRE2tkluc and stimulated for 6 h with either 40 mm KCl (K) or 50 ng/ml BDNF (B) in the presence or absence of a 15-min pretreatment with 0.1 μm FK506 followed by luciferase assays. The firefly luciferase activity was measured and normalized to the Renilla luciferase signal. Data are from five independent experiments, and the mean ± S.E. is shown here. *, a significant increase in luciferase activity by FK506 treatment when compared with the corresponding stimulation in the absence of FK506 p < 0.05. (Student's t test). C, FK506 inhibits KCl-induced expression of a Nur77 reporter gene. Neurons were transfected with 0.1 μg of pRL-TK and 0.5 μg of -1800Nur77luc, a firefly luciferase reporter gene driven by a Nur77 promoter that contains two MREs and four CREs. Cells were stimulated as described in B. The firefly luciferase activity was normalized to the Renilla luciferase signal. Data are from three independent experiments, and the mean ± S.E. is shown here. §, significant reduction of luciferase activity by FK506 treatment when compared with the corresponding stimulation in the absence of FK506; p < 0.05 (Student's t test).
FIGURE 4.
FIGURE 4.
Differential effects of calcineurin inhibition on SRE-mediated and CRE-mediated c-fos expression. A, CRE-mediated c-fos expression is inhibited by FK506. Hippocampal neurons grown in 35-mm dishes for 8 days were transfected with 1 μg of the plasmid pFosΔSRFmyc and 0.5 μg of pSVα1. Plasmid pFosΔSRFmyc contains mutations within the c-fos CArG box (underlined) that binds SRF. The base changes in the mutant are shown in boldface type below the wild-type sequence. 24 h after transfection, cells were either left untreated or pretreated with 0.1 μm FK506 for 15 min, followed by stimulation with 50 mm KCl (KCl) for 50 min. The mRNA levels of human c-fos were determined by qPCR using primers specific for the human c-fos gene and normalized to levels of α-globin mRNA. The normalized c-fos mRNA levels from different conditions are shown in the graph as a percentage of the KCl response. Data are from five independent experiments, and the mean ± S.E. is plotted here. B, SRE-mediated c-fos expression in enhanced by FK506. Hippocampal neurons were transfected and stimulated, and RNA was quantified as in A except that the SRE-dependent reporter gene pFosΔCREmyc was used instead of pFosΔSRFmyc. Plasmid pFosΔCREmyc contains mutations within the c-fos CRE, which is underlined. The base changes in the mutant are shown in boldface type under the wild-type sequence. §, a significant reduction; *, a significant increase in relative mRNA expression in FK506-treated cells when compared with the corresponding stimulation in the absence of FK506; p < 0.05 (Student's t test).
FIGURE 5.
FIGURE 5.
Calcineurin differentially regulates the expression of plasticity-related IEGs. A, schematic diagram showing different DNA-regulatory elements present in Nur77, Nor1, Egr1, and Egr2. A triangle represents an MRE, and a putative MRE-like sequence in the Nor1 promoter is shown here in a lighter shade. A rectangle represents a CRE, and a circle represents an SRE. Black circles indicate SREs that contain a TCF binding site within 10 bp. On the Egr1 gene, there is an SRE that is not accompanied by a TCF binding site and is shown here as a lighter circle. The MREs in the Nor1 promoter have been determined in silico, and the alignment is available in supplemental Fig. 1. B-E, hippocampal neurons at 8-9 days in culture were either left untreated or pretreated with 1 μm CsA or 0.1 μm FK506 for 15 min, followed by stimulation with 50 mm KCl (K) or 10 μm forskolin (Fo) for 50 min. The mRNA levels of Nur77 (B), Nor1 (C), Egr1 (D), and Egr2 (E) were determined by qPCR and were normalized to glyceraldehyde-3-phosphate dehydrogenase transcript levels. Data are from five independent experiments and are shown here as mean ± S.E. *, significant increase (p < 0.05) in relative mRNA expression in CsA- or FK506-treated cells when compared with the corresponding stimulation in the absence of calcineurin inhibitors. §, significant reduction in relative mRNA expression in CsA- or FK506-treated cells when compared with the corresponding stimulation in the absence of calcineurin inhibitors; p < 0.05 (Student's t test).
FIGURE 6.
FIGURE 6.
Expression of the Arc gene is not affected by the inhibition of calcineurin. A, the promoter organization of the Arc gene is depicted here. Synaptic activity-induced Arc expression is mediated by a 100-bp enhancer (SARE) composed of three DNA-regulatory elements, a CRE, an MRE, and a SRE, which are conserved in the rat, mouse, and human genes and are depicted here in boldface type and also underlined. The SRE shown here contains a 3′ CArG box and a 5′ TCF binding site. B, depolarization and cAMP-induced Arc expression are unaffected by CsA and FK506. Hippocampal neurons were either left untreated or pretreated with 1 μm CSA or 0.1 μm FK506 for 15 min, followed by stimulation with 50 mm KCl (K) or 10 μm forskolin (Fo) for 50 min. The mRNA levels of Arc were determined by qPCR and were normalized to glyceraldehyde-3-phosphate dehydrogenase.
FIGURE 7.
FIGURE 7.
Constitutively active calcineurin up-regulates Nor1 protein expression but ameliorates c-Fos protein expression. Hippocampal neurons were transfected with 1 μg of pEFTAG-ΔCn encoding a constitutively active mutant of calcineurin. 24 h after transfection, cells were depolarized with 50 mm KCl for 1 h and stained with an antibody to Nor1 (A) or c-Fos (B) along with an HA tag antibody to detect ΔCn expression. A, representative example of neurons showing Nor1 immunoreactivity (green) in ΔCn-transfected cells (red) and surrounding untransfected neurons. The arrows indicate ΔCn-transfected neurons. Scale bar, 15 μm. B, a graph showing the average Nor1 immunofluorescence in ΔCn-transfected and surrounding untransfected cells. *, significant increase in Nor1 immunofluorescence in ΔCn-expressing cells when compared with Nor1 expression in untransfected cells p < 0.05. Over 100 ΔCn-expressing cells were analyzed. C, example of neurons showing reduced nuclear c-Fos expression (green) in ΔCn-expressing cells (red) compared with surrounding untransfected neurons. Arrows, ΔCn-transfected neurons. D, quantitative analysis of c-Fos immunofluorescence is shown in the graph. §, significant decrease in c-Fos immunofluorescence in ΔCn-expressing cells when compared with surrounding untransfected cells with p < 0.05 (Student's t test).

Similar articles

Cited by

References

    1. Guzowski, J. F., Lyford, G. L., Stevenson, G. D., Houston, F. P., McGaugh, J. L., Worley, P. F., and Barnes, C. A. (2000) J. Neurosci. 20 3993-4001 - PMC - PubMed
    1. Lanahan, A., and Worley, P. (1998) Neurobiol. Learn. Mem. 70 37-43 - PubMed
    1. Mansuy, I. M. (2003) Biochem. Biophys. Res. Commun. 311 1195-1208 - PubMed
    1. Zeng, H., Chattarji, S., Barbarosie, M., Rondi-Reig, L., Philpot, B. D., Miyakawa, T., Bear, M. F., and Tonegawa, S. (2001) Cell 107 617-629 - PubMed
    1. Winder, D. G., and Sweatt, J. D. (2001) Nat. Rev. Neurosci. 2 461-474 - PubMed

Publication types

MeSH terms

LinkOut - more resources