. 2009 Jun 1;18(11):1897-908.
doi: 10.1093/hmg/ddp110. Epub 2009 Mar 8.

Defects in myelination, paranode organization and Purkinje cell innervation in the ether lipid-deficient mouse cerebellum

Affiliations

Defects in myelination, paranode organization and Purkinje cell innervation in the ether lipid-deficient mouse cerebellum

Andre Teigler et al. Hum Mol Genet. .

Abstract

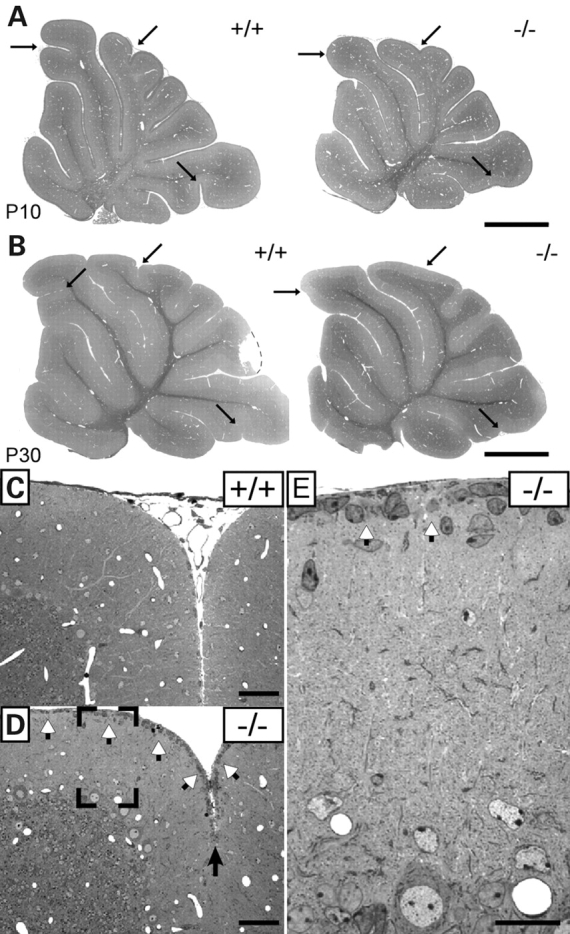
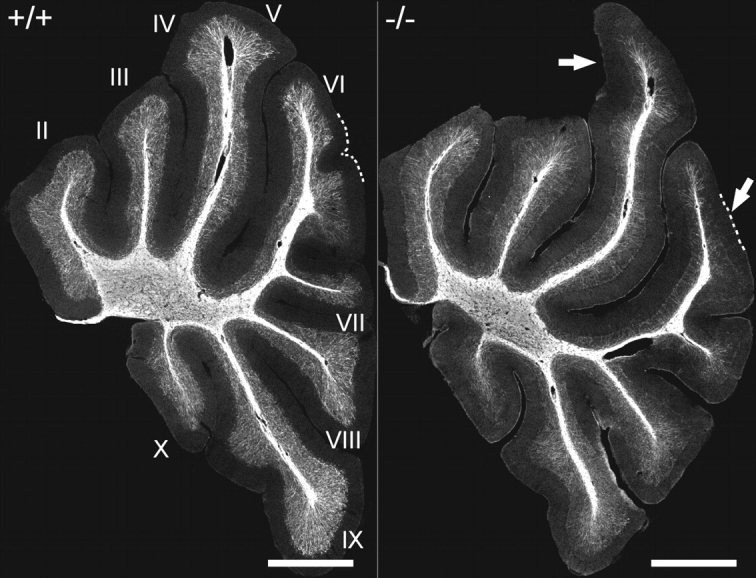
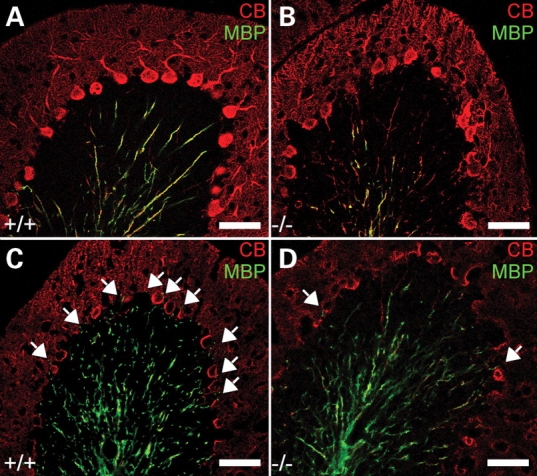
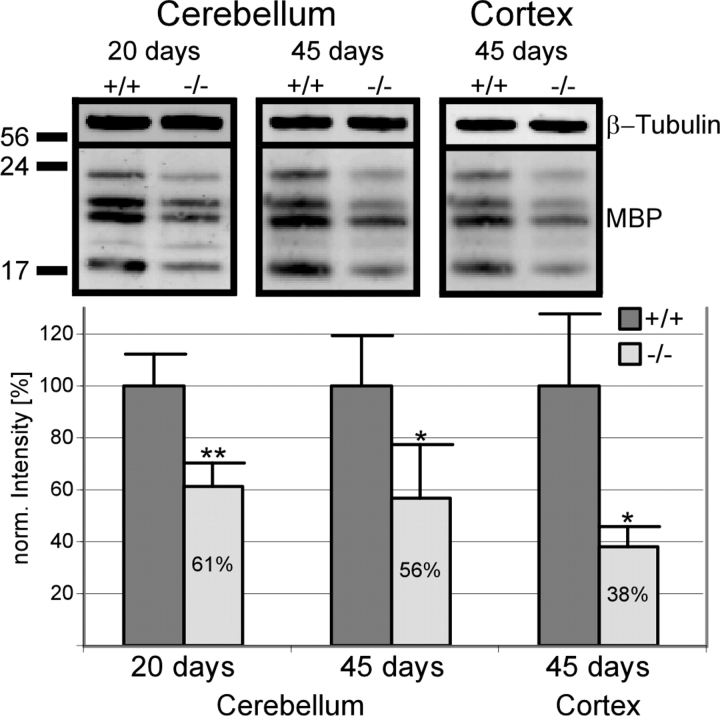
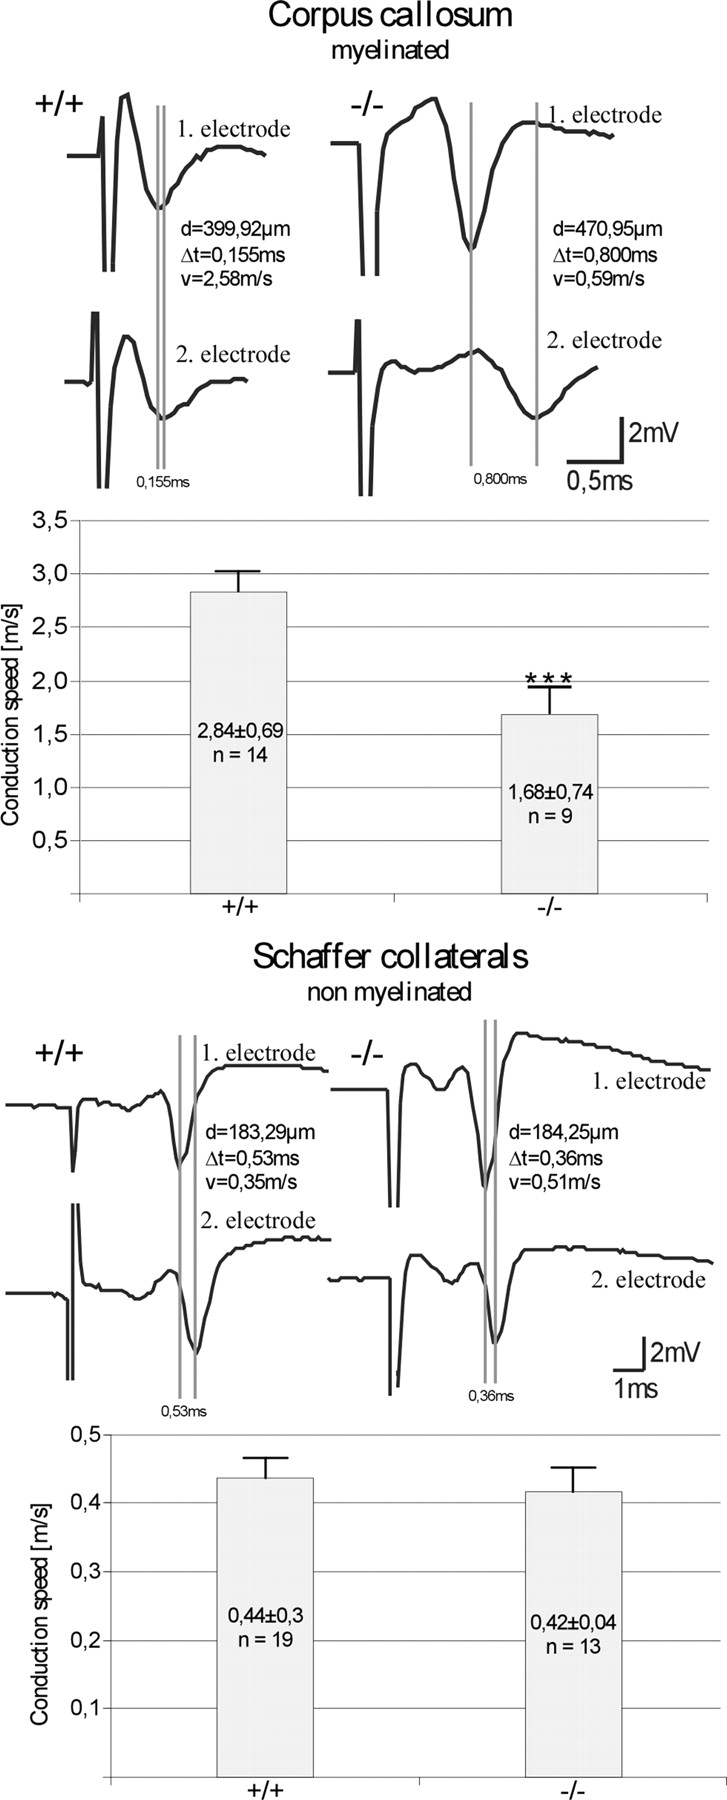
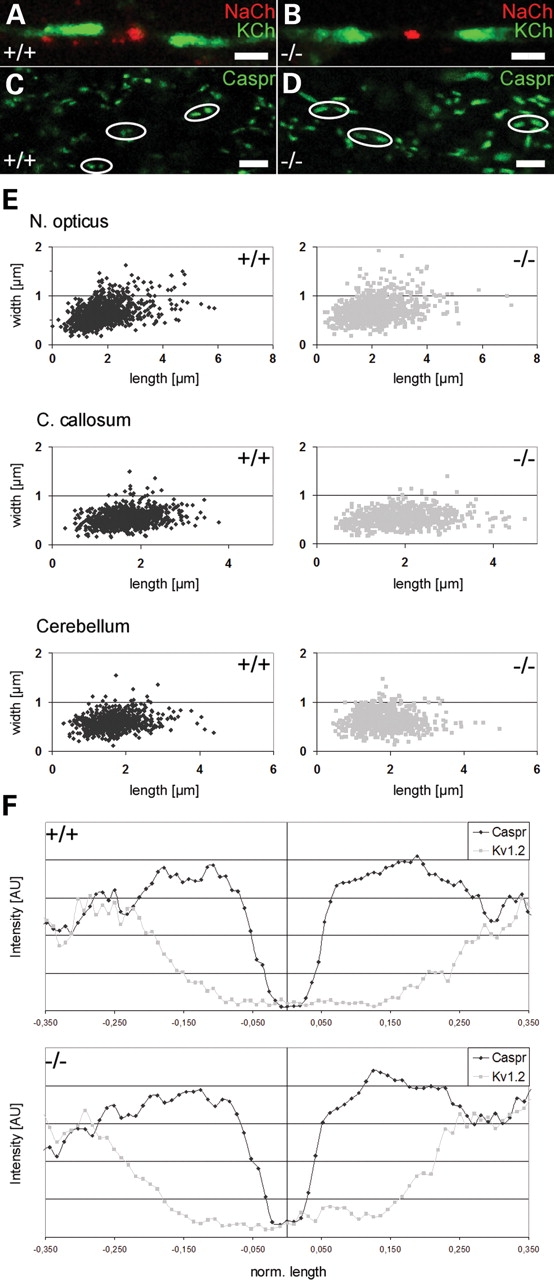
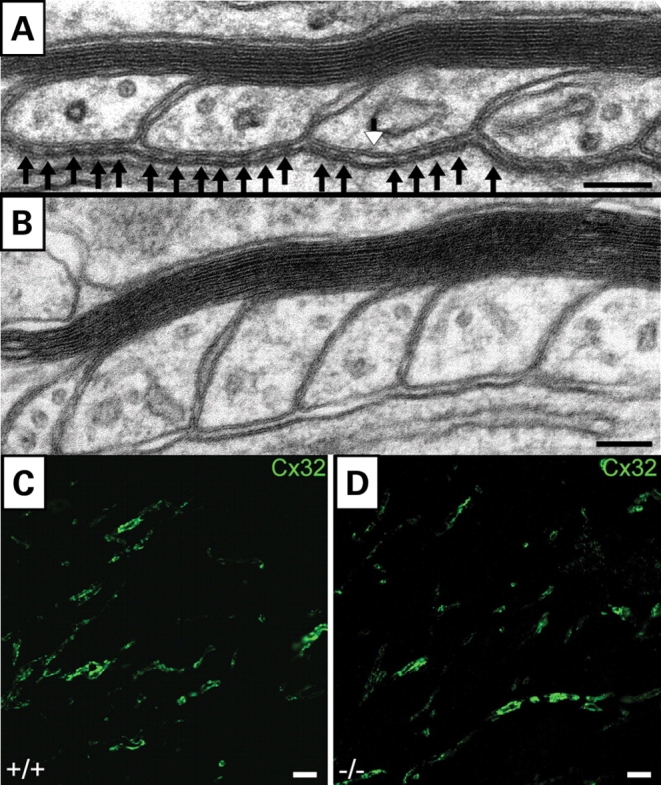
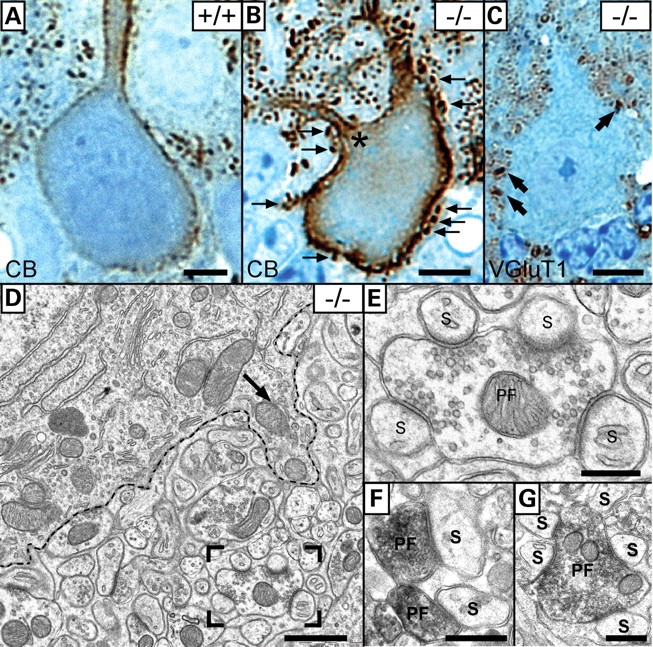
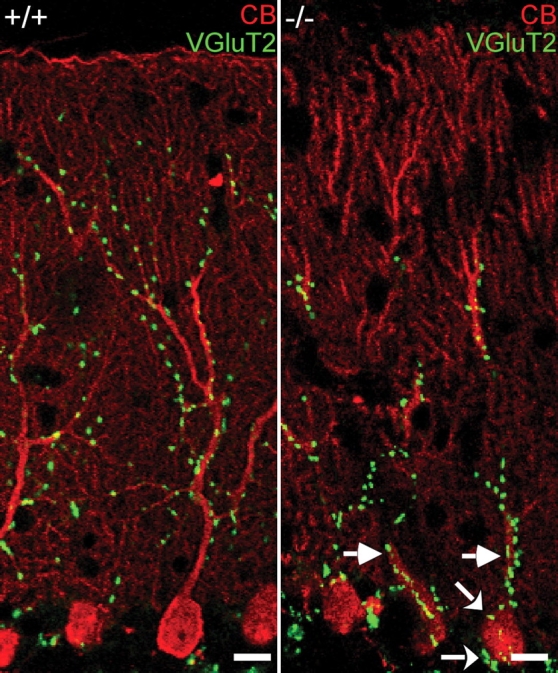
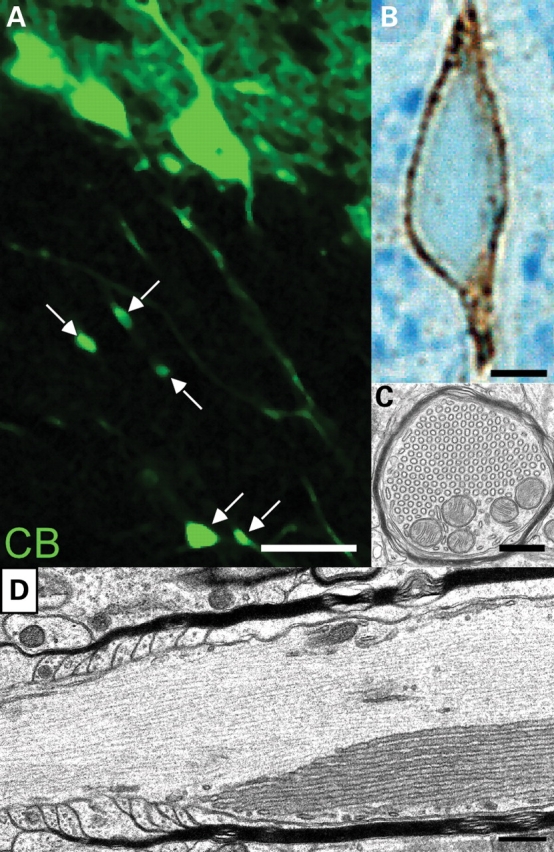
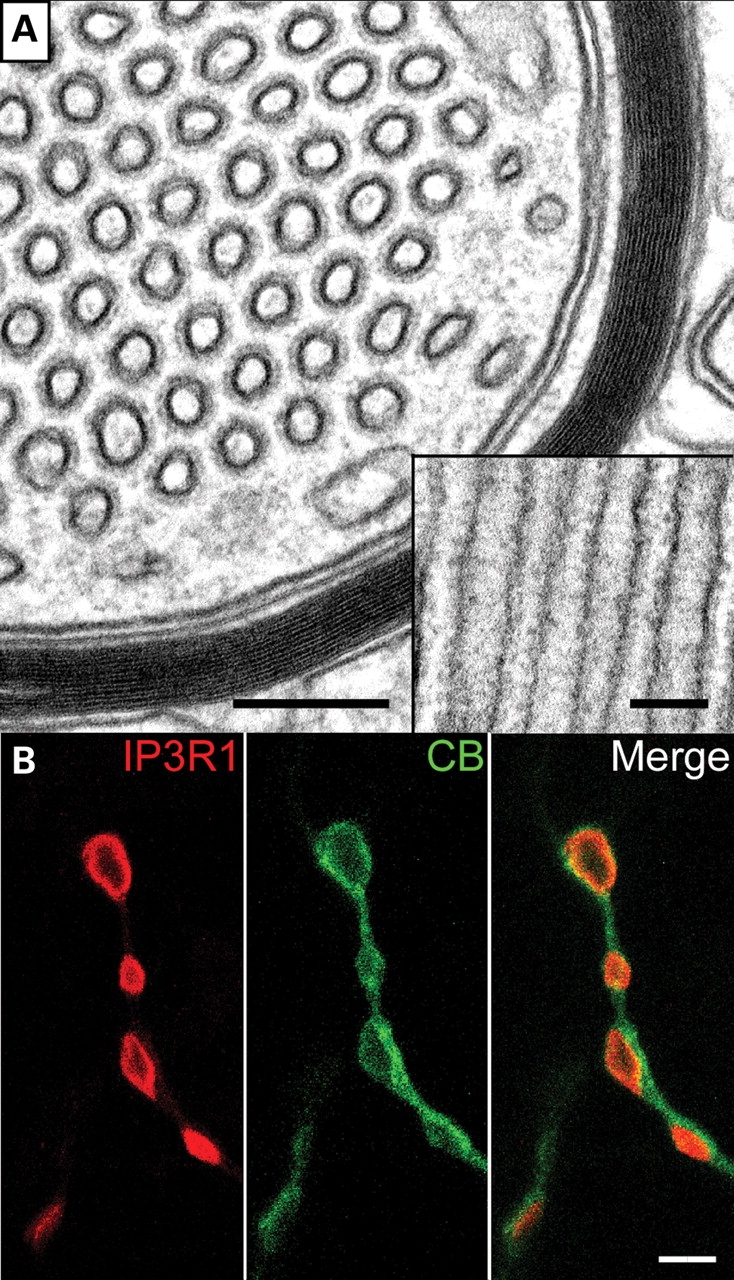
Ether lipids (ELs), particularly plasmalogens, are essential constituents of the mammalian central nervous system. The physiological role of ELs, in vivo, however is still enigmatic. In the present study, we characterized a mouse model carrying a targeted deletion of the peroxisomal dihydroxyacetonephosphate acyltransferase gene that results in the complete lack of ELs. Investigating the cerebellum of these mice, we observed: (i) defects in foliation patterning and delay in precursor granule cell migration, (ii) defects in myelination and concomitant reduction in the level of myelin basic protein, (iii) disturbances in paranode organization by extending the Caspr distribution and disrupting axo-glial septate-like junctions, (iv) impaired innervation of Purkinje cells by both parallel fibers and climbing fibers and (v) formation of axon swellings by the accumulation of inositol-tris-phosphate receptor 1 containing smooth ER-like tubuli. Functionally, conduction velocity of myelinated axons in the corpus callosum was significantly reduced. Most of these phenotypes were already apparent at P20 but still persisted in 1-year-old animals. In summary, these data show that EL deficiency results in severe developmental and lasting structural alterations at the cellular and network level of the cerebellum, and reveal an important role of ELs for proper brain function. Common molecular mechanisms that may underlie these phenotypes are discussed.


Figures

Figure 1.
Figure 1.
Alterations in foliation patterning (A and B) at P10 and P30 and delay in granule cell precursor migration (CE) in control (+/+) and EL-deficient (−/−) cerebellum at P20. Arrows indicate poorly developed interculminate, declival and uvula fissures. White arrowheads in (D and E) point to granule cell precursors still residing in the external granule layer at the pial surface. Scale bars represent 1 mm (A and B), 50 µm (C and D) and 20 µm (E).
Figure 2.
Figure 2.
Foliation patterning and myelination in the cerebellum of P20 control (+/+) and DAPAT knockout (−/−) mice. Roman numerals indicate individual folia. Arrows mark the most conspicuous differences in foliation between controls and knockouts. Note the severe reduction in myelination especially in folium VI. The cerebellar sections correspond to Bregma 0.0–0.5 mm. Sections of six wild-type and six knockout animals were analyzed. The data of one pair of animals are representatively shown. Scale bars correspond to 1 mm.
Figure 3.
Figure 3.
Dysmyelination of PC axons in DAPAT knockout mice. PCs and PC axons in sagittal cerebellar slices (20 µm) corresponding to Bregma 0.0–0.5 mm of controls (+/+) and EL-deficient (−/−) mice at P20 (A and B) and P45 (C and D) were stained for CB (red) and myelin (MBP, green). Note that the non-myelinated portion of the PC axon is significantly increased in EL-deficient mice. The arrows mark myelinated fibers within the PC layer. Scale bars correspond to 50 µm.
Figure 4.
Figure 4.
Decreased MBP concentration in cerebellum (P20 and P45) and neocortex (P45) of wild-type (+/+) and DAPAT knockout (−/−) mice by gel electrophoresis and western blotting (upper panel). β-Tubulin was used as a marker for loading equal amounts of protein. The densitometric evaluation of blot signals (lower panel) was done using the Odyssey system. The tissue of four wild-type and four knockout animals was analyzed. For statistical analysis the unpaired t-test was used (**P ≤ 0.01; *P ≤ 0.05). Data are expressed as mean ± SD.
Figure 5.
Figure 5.
Reduced action potential conduction velocity in myelinated fibers of control (+/+) and DAPAT-deficient (−/−) mice. Evoked population spike from two different recording sites along the corpus callosum (upper panels) and the CA1 pyramidal cell layer (lower panels). Electrical stimulation was performed upstream from the first electrode within the corpus callosum (artifact truncated) and within the stratum radiatum (Schaffer collateral, artifact truncated). The vertical lines indicate the run time difference between the two recording sites (d, distance of the two recording sites; Δt, run time; v, velocity). The corresponding bar diagram shows the statistical evaluation of 9–19 independent experiments. Note the significant reduction in conduction velocity in myelinated fibers of the EL-deficient corpus callosum. The trace shown represents one with lower measured velocity. For statistical analysis, the Mann–Whitney U-test was used (***P < 0.01). Data are expressed as mean ± SEM.
Figure 6.
Figure 6.
Increase in paranodal length in myelinated axons of EL-deficient mice. The distribution of Nav+ and Kv+ channels (A and B) in the optic nerve did not show differences between controls (+/+) and EL-deficient (−/−) mutants at P42. However, paranodal length, as revealed by Caspr immunofluorescence staining was significantly increased in optic nerve (C and D), corpus callosum and cerebellum of EL-deficient mice. The dispersion of the Caspr signal in optic nerve, corpus callosum and cerebellum is further demonstrated by plotting paranodal length versus paranodal width (E). Quantitative analysis of normalized distribution of Caspr and Kv1.2 signals in optic nerve, cerebellum and corpus callosum (only the data for corpus callosum are shown in F) did not show differences between controls and mutants suggesting that the relative location of Caspr and Kv1.2 in wild-types and mutants was the same. A total number of 2–4 wild-type and knockout animals was analyzed. Paranodal length and width of more than 700 paranodes of each tissue were statistically evaluated (Table 1). Scale bars correspond to 2 µm (A and B) and 5 µm (C and D).
Figure 7.
Figure 7.
Structural alterations in PC septate-like junctions in P45 mutant cerebellum. (A) Ultrastructure of PC axo-glial loops showing individual septate-like junctions (black arrows). Occasionally, the typical transverse bands are missing (white arrowhead) or as in some paranodes (B) are completely absent. Compact myelin (A and B) seems to be intact. Gap junctions between glial loops (C and D) appear not to be affected as shown by immunofluorescence staining of Cx32 (green) in control (+/+) and EL-deficient (−/−) animals. Scale bars correspond to 100 nm (A and B) and 5 µm (C and D).
Figure 8.
Figure 8.
Formation of a ‘hyperspiny’ PC phenotype in El-deficient mice. (A and B) Calbindin (CB) ABC/DAB-enhanced immunohistochemical staining shows a hyperspiny PC of the mutant cerebellum (B) compared with the control (A). The hyperspiny character is distinguished by additional dendrites (asterisk in B) and spines (arrows in B) at both cell somata (arrow in D) and proximal dendrites. VGluT1 staining revealed enlarged PF synapses (‘synapse clusters’, arrow in C) that were located near the cell soma highlighted by the dashed line (D). Unusually, these enlarged PFs formed synapses with four (boxed area in D and E) and five PC spines (G) as demonstrated by VGlut1 staining at the EM level. In wild-type mice, a PF to spine ratio of 1:1 is usually maintained (F). (A–C) Semithin sections counter-stained with methylene blue–azure II. Scale bars correspond to 10 µm (A–C), 1 µm (D) and 500 nm (E–G).
Figure 9.
Figure 9.
Phenotypically altered CF territory in mutant cerebellum. In mutants, CFs reside on PC somata (curved arrows) and proximal dendritic trunk (straight arrows) and occupy a severely restricted area of PC innervation. Double immunofluorescence of CB (red) and VGluT2 (green) in folium VI of a 1-year-old animal. Scale bars correspond to 10 µm.
Figure 10.
Figure 10.
Formation of axonal swellings in PCs of folium VI of EL-deficient cerebellum at P30. PC axons were visualized by CB immunofluorescence (A) and ABC/DAB enhancement followed by osmification, Epon embedding, semithin sectioning and counter-staining with methylene blue–azure II (B). Swellings located in the granular layer were marked with arrows. The CB-positive axoplasm surrounds the smooth ER-like aggregates that are composed of tubules arranged in a hexagonal array (C). Frequently, these axon swellings were observed close to the node of Ranvier (D). A total number of 10 wild-type and 10 knockout animals was analyzed. The data of one pair of animals are representatively shown. Scale bars correspond to 20 µm (A), 2.5 µm (B) and 500 nm (C and D).
Figure 11.
Figure 11.
IP3R-containing smooth ER-like tubular stacks accumulating in PC axonal swellings. (A) The ultrastructural cross section reveals tubular structures of average diameter of 50–70 nm. The inset shows a longitudinal view of the tubuli. The membranes are regularly decorated by protein complexes of about 10 nm in size. (B) Localization of IP3R1 (red) in swellings of PC axons (calbindin staining in green). Scale bars correspond to 200 and 100 nm (A) and 2 µm (B).

References

    1. Moser H.W. Molecular genetics of peroxisomal disorders. Front. Biosci. 2000;5:D298–D306. - PubMed
    1. Wanders R.J., Waterham H.R. Peroxisomal disorders I: biochemistry and genetics of peroxisome biogenesis disorders. Clin. Genet. 2005;67:107–133. - PubMed
    1. Gorgas K., Teigler A., Komljenovic D., Just W.W. The ether lipid-deficient mouse: tracking down plasmalogen functions. Biochim. Biophys. Acta. 2006;1763:1511–1526. - PubMed
    1. Nagan N., Zoeller R.A. Plasmalogens: biosynthesis and functions. Prog. Lipid Res. 2001;40:199–229. - PubMed
    1. Zoeller R.A., Morand O.H., Raetz C.R. A possible role for plasmalogens in protecting animal cells against photosensitized killing. J. Biol. Chem. 1988;263:11590–11596. - PubMed

Publication types