. 2009 Apr;6(4):297-303.
doi: 10.1038/nmeth.1310. Epub 2009 Mar 8.

Automated monitoring and analysis of social behavior in Drosophila

Affiliations

Automated monitoring and analysis of social behavior in Drosophila

Heiko Dankert et al. Nat Methods. 2009 Apr.

Abstract

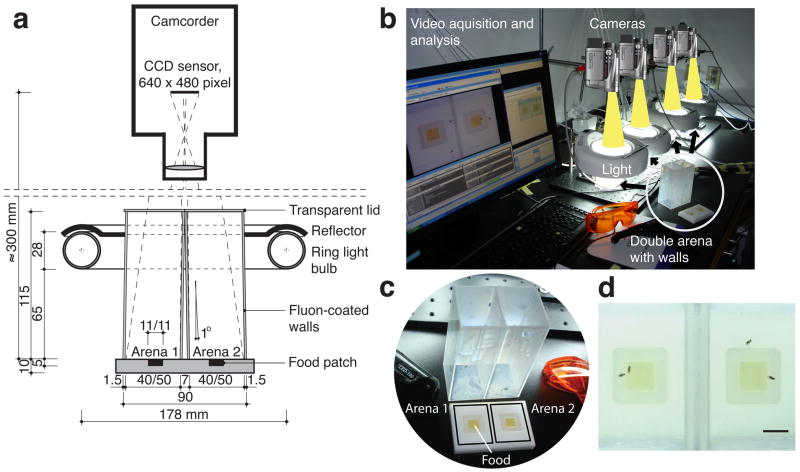
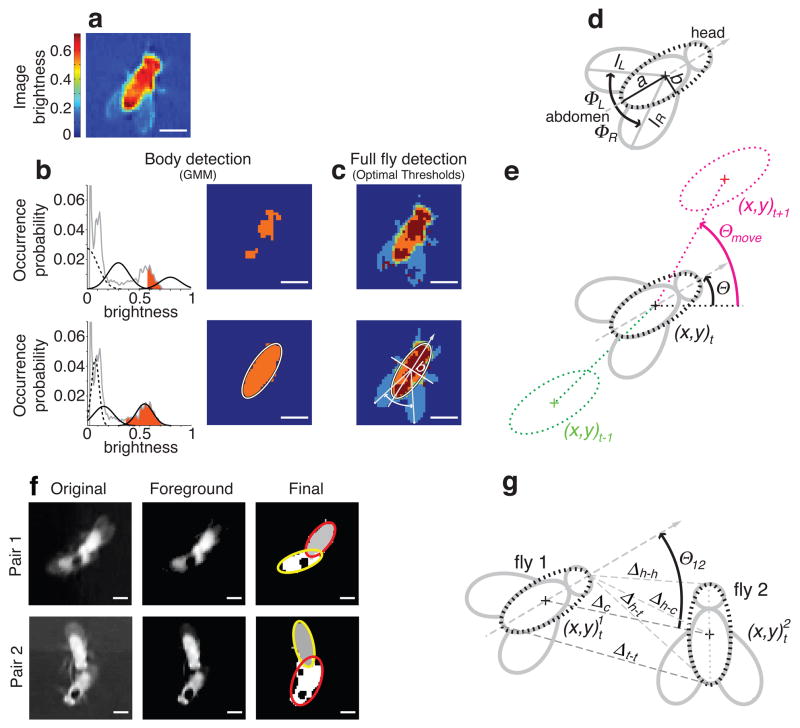
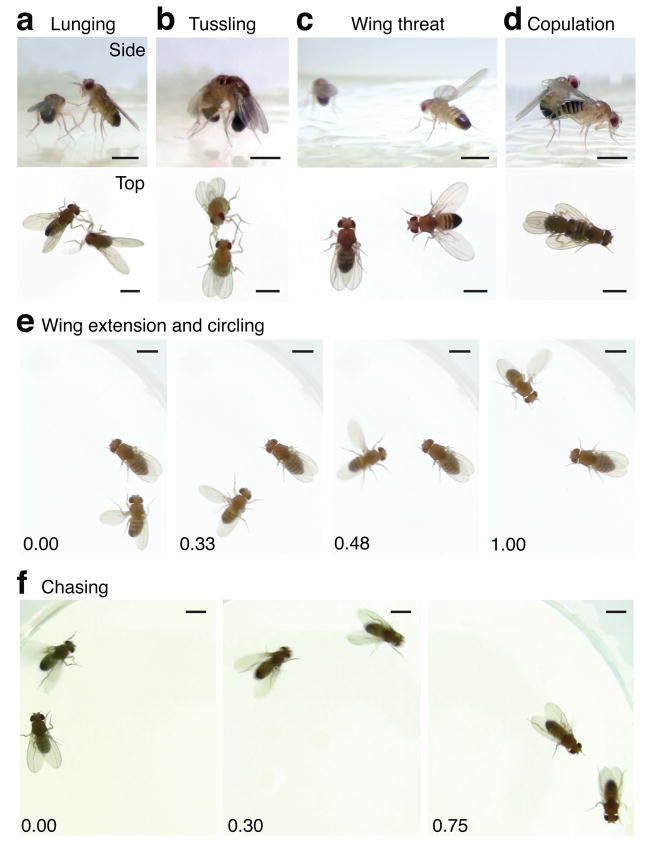
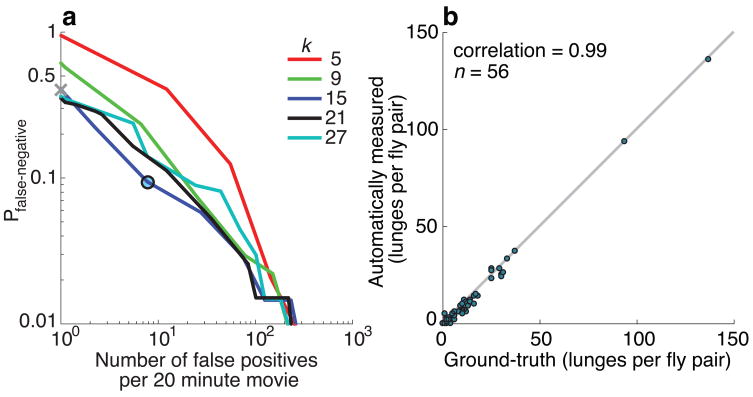
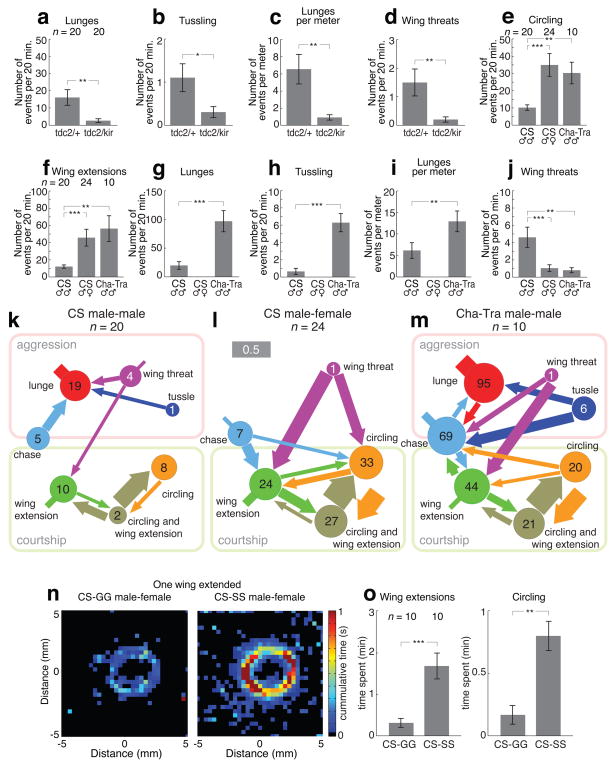
We introduce a method based on machine vision for automatically measuring aggression and courtship in Drosophila melanogaster. The genetic and neural circuit bases of these innate social behaviors are poorly understood. High-throughput behavioral screening in this genetically tractable model organism is a potentially powerful approach, but it is currently very laborious. Our system monitors interacting pairs of flies and computes their location, orientation and wing posture. These features are used for detecting behaviors exhibited during aggression and courtship. Among these, wing threat, lunging and tussling are specific to aggression; circling, wing extension (courtship 'song') and copulation are specific to courtship; locomotion and chasing are common to both. Ethograms may be constructed automatically from these measurements, saving considerable time and effort. This technology should enable large-scale screens for genes and neural circuits controlling courtship and aggression.


Figures

Figure 1
Figure 1. Imaging setup for genetic screens in Drosophila. (a)
Lateral cut through our double-chamber (all lengths in millimeter). (b) Example of a high-throughput behavioral screening assay - 4 double-chambers, 4 cameras, 2 PCs, and standard video-acquisition software. (c) Double-chamber with the walls removed to expose the floor. (d) Camera view of the double chamber. Each of the two arenas has food in the centre, surrounded by agarose; walls are coated with Fluon. Bar, 10 mm.
Figure 2
Figure 2. Detection and tracking of fruit flies. (a–c)
Fly segmentation procedure. (a) ‘Foreground image’ FI, computed by dividing the original image I by (μI + 3σI) (FI values in false-colors). (b) The fly body is localized by fitting a Gaussian mixture model (GMM) with three Gaussians (black curves; background (dashed), other parts and body (solid)) to the histogram of FI values (gray curve) using the Expectation Maximization (EM) algorithm. First (top) and final (bottom) iterations of the GMM-EM optimization. All pixels with brightness values greater than the value at the intersection of the solid black Gaussians (orange areas) are assigned to the body, and are fit with an ellipse. (c) Full fly detection by segmenting the complete fly from the background, with body parts and wings (empirically represented as four segments/colors). First iteration (top) and final result (bottom). (d) Head and abdomen are resolved by dividing the fly along the minor axis b and comparing the brightness-value distribution of both halves (head is brighter; see also c). The wings (lL, lR, φL, φR) are measured by detecting, on each side of the fly’s posterior half, the pixel with the furthest distance from the center of the ellipse (wing tip) in the segmented full fly. (e) Definition of fly orientation Θ and moving direction Θmove. (f) Separation of occluding (pair 1) and touching flies (pair 2). Original image (left), foreground image (center), and final segmentation result (right) with the corresponding ellipses. (g) Definition of additional features. Bars, 1 mm.
Figure 3
Figure 3. Detectable actions
(a–d) Single shots of side and top views of (a) lunging, (b) tussling, (c) wing threat, and (d) copulation. High-resolution sequences of (e) wing extension and circling, as well as (f) chasing (see also Supplementary Videos 1–7 online). Time index in seconds is relative to the first frame in each movie clip. Bars, 1 mm. Supplementary Figure 1 online shows the same actions as detected by our system.
Figure 4
Figure 4. Performance of action detection. (a)
Performance of our lunge detector, described by the Receiver Operating Characteristic (ROC). Each ROC curve gives the fraction of false-negatives (number of missed lunges divided by the total number of lunges on the ground truth) vs the number of false-positives. Curves are shown for different values of k-nearest neighbors constant k. Best performance is achieved for k = 15. The operating point of the system is shown by a black circle; it is obtained by labeling an action ‘lunge’ when 12 or more of its k = 15 nearest-neighbors are lunges. The performance of an expert human observer (40% missed lunges) is indicated by the gray cross. The expert detected 84 lunges, while our two-step process for establishing ground-truth (see Methods) yielded 139 lunges. (b) Comparison between automatically measured lunges and ground-truth. Each dot represents the number of lunges detected automatically (Y axis) vs the number of lunges in the ground truth (X axis) for each of 56 20-minute movies of fly pairs. Note that automatic counting is very close to ground-truth both when there are many lunges and when there are few.
Figure 5
Figure 5. Genetic and environmental influences on aggressive and courtship behavior. (a,g)
Number of lunges, (b,h) tussling, (c,i) lunges per meter, (d,j) wing threats, (e) circling, (f) wing extensions. All panels show mean and standard error of the mean. (a–d) Octopamine control (tdc2/+) and mutant (tdc2/kir). (e–j) CS male-male, male-female, and Cha-Gal4;UAS-tra (“Cha-Tra”) male-male pairs. (k–m) Ethograms, based on transition matrices. The ethograms show transitions where the interval between a fly’s action and the next lasted ≤ 10 seconds. We count intervals > 10 seconds without action as ‘no action’ nodes (not shown). The transition probability is represented by the thickness of the arrows (normalized over all arrows that exit a node including the arrow into ‘no action’). The arrow stumps represent the transition probability from one action into the same action. Circle diameters (logarithmically scaled) and numbers denote the average action frequencies. (n) Frequency of CS male-fly positions while extending a wing towards a decapitated CS female. Left: group-housed flies (GG, n = 10); right: single-housed flies (SS, n = 10). (o)

Comment in

  • The ethomics era?
    Reiser M. Reiser M. Nat Methods. 2009 Jun;6(6):413-4. doi: 10.1038/nmeth0609-413. Nat Methods. 2009. PMID: 19478800 No abstract available.

References

    1. Manoli DS, Foss M, Villella A, Taylor BJ, Hall JC, Baker BS. Male-specific fruitless specifies the neural substrates of Drosophila courtship behaviour. Nature. 2005;436:395–400. - PubMed
    1. Demir E, Dickson BJ. fruitless splicing specifies male courtship behavior in Drosophila. Cell. 2005;121:785–794. - PubMed
    1. Stockinger P, Kvitsiani D, Rotkopf S, Tirian L, Dickson BJ. Neural circuitry that governs Drosophila male courtship behavior. Cell. 2005;121:795–807. - PubMed
    1. Vrontou E, Nilsen SP, Demir E, Kravitz EA, Dickson BJ. fruitless regulates aggression and dominance in Drosophila. Nat Neurosci. 2006;9:1469–1471. - PubMed
    1. Manoli DS, Meissner GW, Baker BS. Blueprints for behavior: genetic specification of neural circuitry for innate behaviors. Trends Neurosci. 2006;29:444–451. - PubMed

Publication types

MeSH terms

LinkOut - more resources