. 2009 Apr;16(4):380-9.
doi: 10.1038/nsmb.1570. Epub 2009 Mar 8.

Polyglutamine disruption of the huntingtin exon 1 N terminus triggers a complex aggregation mechanism

Affiliations

Polyglutamine disruption of the huntingtin exon 1 N terminus triggers a complex aggregation mechanism

Ashwani K Thakur et al. Nat Struct Mol Biol. 2009 Apr.

Abstract

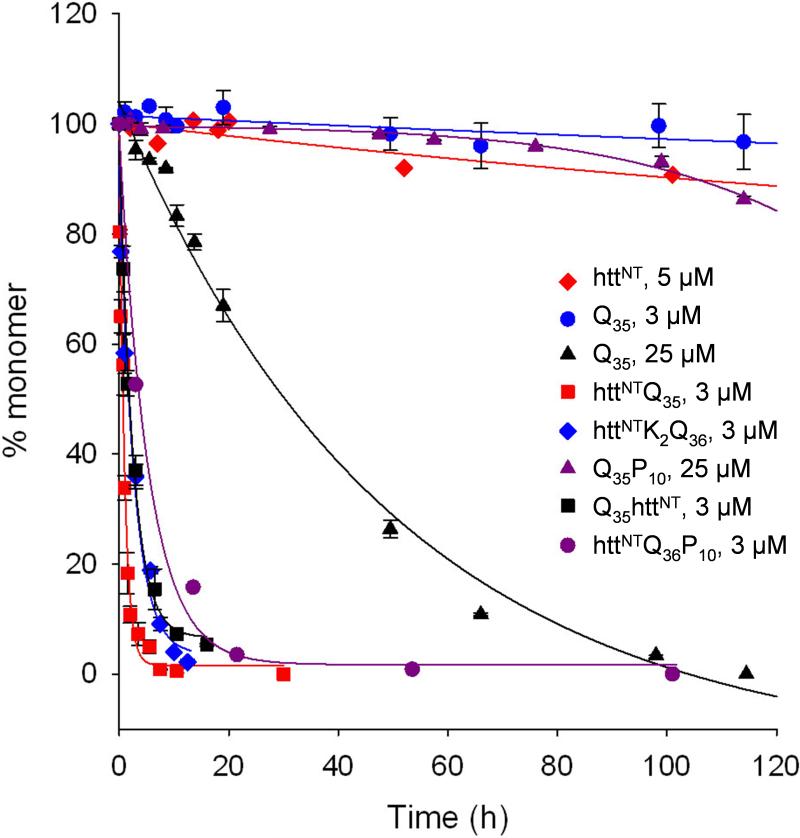
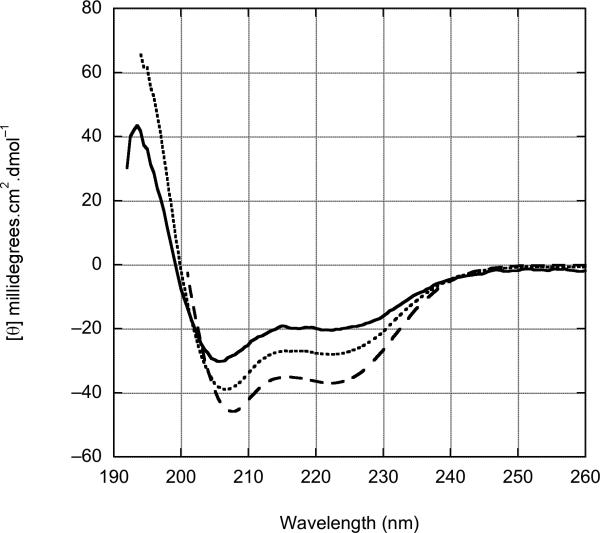
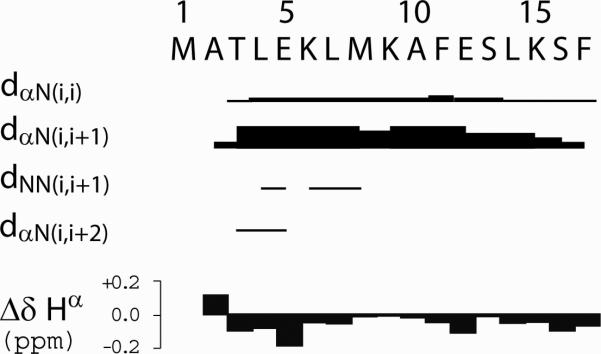
Simple polyglutamine (polyQ) peptides aggregate in vitro via a nucleated growth pathway directly yielding amyloid-like aggregates. We show here that the 17-amino-acid flanking sequence (HTT(NT)) N-terminal to the polyQ in the toxic huntingtin exon 1 fragment imparts onto this peptide a complex alternative aggregation mechanism. In isolation, the HTT(NT) peptide is a compact coil that resists aggregation. When polyQ is fused to this sequence, it induces in HTT(NT), in a repeat-length dependent fashion, a more extended conformation that greatly enhances its aggregation into globular oligomers with HTT(NT) cores and exposed polyQ. In a second step, a new, amyloid-like aggregate is formed with a core composed of both HTT(NT) and polyQ. The results indicate unprecedented complexity in how primary sequence controls aggregation within a substantially disordered peptide and have implications for the molecular mechanism of Huntington's disease.


Figures

Figure 1
Figure 1
Aggregation kinetics of huntingtin exon1 mimic peptides exploring a variety of polyQ repeat lengths. (A) Basic httNT effect: HPLC sedimentation assay following aggregation of httNT (5 μM, R2=0.746, S.D.= ± 2.3), httNTQ35 (3 μM, R2=0.986, S.D.= ± 4.6), Q35 (25 μM, R2=0.993, S.D.= ± 3.8; 3 μM, R2=0.688, S.D.= ± 1.8), Q35httNT (3 μM, R2=0.996, S.D.= ± 3.0), httNTQ36P10 (3 μM, R2=0.992, S.D.= ± 4.3), Q35P10 (25 μM, R2=0.973, S.D.= ± 0.8), httNTK2Q36 (3 μM, R2=0.981, S.D.= ± 1.0); (B) Role of polyQ repeat length on 5 μM peptides. HPLC sedimentation assay following aggregation of httNT (R2=0.746, S.D.= ±2.3), httNTQ3 (F17W) (R2=0.966, S.D.= ±2.1), httNTQ15 (F17W) (R2=0.971, S.D.= ± 3.2), httNTQ25 (F17W) (R2=0.992, S.D.= ± 3.3), httNTQ35 (R2=0.993, S.D.= ± 4.3); (C) Role of httNT mutations in a httNTQ20P10 peptides (see Table 1) incubated at ∼ 6 μM: wild type httNT (R2=0.992, S.D.= ±3.1); F17W (R2=0.997, S.D.= ±2.1); F11W (R2=0.991, S.D.= ±3.7); F11A / F17A (R2=0.987, S.D.= ±2.5); M1X / M8X (R2=0.998, S.D.= ±1.4); M1X / M8X / F11A / F17A (R2=0.628, S.D.= ±3.5); (D) Role of httNT sequence in nucleation of aggregation: concentration dependence of early aggregation rates for Q30 (slope = 2.57, R2=0.9987, S.D. = ±0.026) and httNTQ30P6 (slope = 1.20, R2=0.9445, S.D. = ±0.150). All reactions were conducted in PBS at 37 °C. X = methionine sulfoxide.
Figure 1
Figure 1
Aggregation kinetics of huntingtin exon1 mimic peptides exploring a variety of polyQ repeat lengths. (A) Basic httNT effect: HPLC sedimentation assay following aggregation of httNT (5 μM, R2=0.746, S.D.= ± 2.3), httNTQ35 (3 μM, R2=0.986, S.D.= ± 4.6), Q35 (25 μM, R2=0.993, S.D.= ± 3.8; 3 μM, R2=0.688, S.D.= ± 1.8), Q35httNT (3 μM, R2=0.996, S.D.= ± 3.0), httNTQ36P10 (3 μM, R2=0.992, S.D.= ± 4.3), Q35P10 (25 μM, R2=0.973, S.D.= ± 0.8), httNTK2Q36 (3 μM, R2=0.981, S.D.= ± 1.0); (B) Role of polyQ repeat length on 5 μM peptides. HPLC sedimentation assay following aggregation of httNT (R2=0.746, S.D.= ±2.3), httNTQ3 (F17W) (R2=0.966, S.D.= ±2.1), httNTQ15 (F17W) (R2=0.971, S.D.= ± 3.2), httNTQ25 (F17W) (R2=0.992, S.D.= ± 3.3), httNTQ35 (R2=0.993, S.D.= ± 4.3); (C) Role of httNT mutations in a httNTQ20P10 peptides (see Table 1) incubated at ∼ 6 μM: wild type httNT (R2=0.992, S.D.= ±3.1); F17W (R2=0.997, S.D.= ±2.1); F11W (R2=0.991, S.D.= ±3.7); F11A / F17A (R2=0.987, S.D.= ±2.5); M1X / M8X (R2=0.998, S.D.= ±1.4); M1X / M8X / F11A / F17A (R2=0.628, S.D.= ±3.5); (D) Role of httNT sequence in nucleation of aggregation: concentration dependence of early aggregation rates for Q30 (slope = 2.57, R2=0.9987, S.D. = ±0.026) and httNTQ30P6 (slope = 1.20, R2=0.9445, S.D. = ±0.150). All reactions were conducted in PBS at 37 °C. X = methionine sulfoxide.
Figure 2
Figure 2
Electron micrographs of various httNT-related aggregates. httNTQ30P6 was incubated in PBS at 37 °C and sampled at 0 hrs (A), 15 mins (B), 2.5 hrs (C, D, E), 5.5 hrs (F, G), 24 hrs (H, I), 48 hrs (J) and 100 hrs (K). httNTQ3 (F17W) was incubated in PBS at 37 °C for 800 hrs (L). All samples were transferred directly from reaction mixture to freshly glow-discharged carbon-coated grids and stained with 1% uranyl acetate. Scale bar = 50 nm.
Figure 3
Figure 3
State of expansion of the httNT peptide in solution. (A) Fractional migration (Kav) versus log MW of various peptides in size exclusion chromatography. The straight line is fitted to the Kav values for the simple polyQ peptides Q15, Q20, Q29, and Q35. α-helix-rich peptide Bal and the polyproline type II rich peptide Pro14 are extended. Insulin (“Ins”), aprotinin (“Apr”), and httNT are relatively compact. (B) Average httNT end-to-end separation calculated from FRET measurements for mutants FRET-httNTQ3, FRET-httNTQ20P10, and FRET-httNTQ37P10, compared with their F17W analogs. Also included is the value for FRET-httNTQ3 studied in 6M urea in PBS. The dotted line shows the average end-to-end distance (34.5 ± 4 Å) between residues 1 and 17 calculated from polymer theory for a peptide in statistical coil. Asterisks indicate statistical significance of each measurement with respect to that for httNTQ3 in PBS (*, p < 0.01; **, p < 0.001).
Figure 4
Figure 4
Concentration dependent circular dichroism spectra of httNT. (A) httNT in aqueous buffer (see Methods) at 35 °C in concentrations of 3.8 μM (———),7.5 μM (······), and 18.9 μM (------). ContinLL predicts significant secondary structure: 12% unordered, 4% β-strand, 20% turn, 8% polyproline type II helix, and 55% α-helix. (B) httNT in the presence of 10% trifluoroethanol (TFE) at 37 °C in concentrations of 7.5 μM (———), 18.9 μM (······), 94 μM (------). In the presence of this relatively low TFE concentration, the httNT adopts an α-helical structure, as evidenced by the negative bands at 208 and 222nm. The development of structure is protein concentration dependent, suggesting an oligomeric state under these conditions.
Figure 4
Figure 4
Concentration dependent circular dichroism spectra of httNT. (A) httNT in aqueous buffer (see Methods) at 35 °C in concentrations of 3.8 μM (———),7.5 μM (······), and 18.9 μM (------). ContinLL predicts significant secondary structure: 12% unordered, 4% β-strand, 20% turn, 8% polyproline type II helix, and 55% α-helix. (B) httNT in the presence of 10% trifluoroethanol (TFE) at 37 °C in concentrations of 7.5 μM (———), 18.9 μM (······), 94 μM (------). In the presence of this relatively low TFE concentration, the httNT adopts an α-helical structure, as evidenced by the negative bands at 208 and 222nm. The development of structure is protein concentration dependent, suggesting an oligomeric state under these conditions.
Figure 5
Figure 5
Proton NMR analysis of httNT. (A) Summary of NOE and secondary 1H chemical shift (Δδ Hα) data observed for httNT at 800 MHz, 5 °C in 10 mM phosphate buffer, pH 7.2. The relative intensities of the inter-proton NOEs dαN(i,i), dαN(i,i+1), dNN(i,i+1), dNN(i,i) and dαN(i,i+2) are depicted by the thickness of the lines. The Hα secondary chemical shift values of httNT (Δδ Hα) were calculated by subtracting random coil values from the Hα chemical shifts of httNT; (B) 2D proton TOCSY and NOESY NMR spectra. Superposition of the Hα-HN (top) and HN-HN (bottom) regions of the TOCSY (black) and NOESY (red) spectra illustrate sequential dαN(i,i+1) and dNN(i,i+1) connectivities. The intra-residue Hα(i)-HN(i) cross-peaks are labeled with residue name and number and sequential Hα(i)-HN(i+1) and HN(i)-HN(i+1) NOE cross-peaks are connected for consecutive residues. The only observed, very small non-sequential Hα(i)-HN(i+2) NOE cross-peak connecting Thr3 Hα and Glu5 HN protons is marked with a red circle and labeled in red in the top panel.
Figure 5
Figure 5
Proton NMR analysis of httNT. (A) Summary of NOE and secondary 1H chemical shift (Δδ Hα) data observed for httNT at 800 MHz, 5 °C in 10 mM phosphate buffer, pH 7.2. The relative intensities of the inter-proton NOEs dαN(i,i), dαN(i,i+1), dNN(i,i+1), dNN(i,i) and dαN(i,i+2) are depicted by the thickness of the lines. The Hα secondary chemical shift values of httNT (Δδ Hα) were calculated by subtracting random coil values from the Hα chemical shifts of httNT; (B) 2D proton TOCSY and NOESY NMR spectra. Superposition of the Hα-HN (top) and HN-HN (bottom) regions of the TOCSY (black) and NOESY (red) spectra illustrate sequential dαN(i,i+1) and dNN(i,i+1) connectivities. The intra-residue Hα(i)-HN(i) cross-peaks are labeled with residue name and number and sequential Hα(i)-HN(i+1) and HN(i)-HN(i+1) NOE cross-peaks are connected for consecutive residues. The only observed, very small non-sequential Hα(i)-HN(i+2) NOE cross-peak connecting Thr3 Hα and Glu5 HN protons is marked with a red circle and labeled in red in the top panel.
Figure 6
Figure 6
PONDR analysis of the first 600 amino acids of the human huntingtin sequence. Segments with low PONDR scores are predicted to be stably folded, and high scores (near 1) disordered. Short segments spiking below a PONDR score of 0.5 are predicted to be MoRFs (see text). Calculated using the VX-LT version of PONDR. Access to PONDR® was provided by Molecular Kinetics (6201 La Pas Trail - Ste 160, Indianapolis, IN 46268; 317−280−8737; E-mail: main@molecularkinetics.com ). VL-XT is copyright©1999 by the WSU Research Foundation, all rights reserved. PONDR® is copyright©2004 by Molecular Kinetics, all rights reserved.
Figure 7
Figure 7
Time course of aggregation of httNTQ30P6 (F17W) by multiple analyses. (A) Fluorescence emission maximum of Trp residue at position 17 in resuspended aggregates isolated from reaction of httNTQ30P6 (F17W) (■) or httNTQ3 (F17W) (Δ). The emission maximum of monomeric peptide (•) is plotted as being equivalent to that of initial aggregates, since this is the result obtained for the F17W mutant of the shorter, less rapidly aggregating httNTQ20P10. The httNT aggregation reaction was carried out to 800 hrs, at which time W17 remained completely solvent exposed (not shown). (B) Time course monitored by HPLC sedimentation assay (——◆——), R2=0.983, S.E.= ±6.0), thioflavin T fluorescence (——Δ——, R2=0.994, S.D.= ±3.9) and right angle light scattering (---○---, R2=0.983, S.D.= ±6.0). Inset, first 10 hrs. (C) Dot blots of httNTQ30P6 (F17W) time points using the antibody MW1. Top row: unfractionated aliquots of the reaction mixture (time in hrs; M = non-incubated monomer). Bottom row: equivalent masses of isolated aggregates (no material in the “M” column in this row).
Figure 7
Figure 7
Time course of aggregation of httNTQ30P6 (F17W) by multiple analyses. (A) Fluorescence emission maximum of Trp residue at position 17 in resuspended aggregates isolated from reaction of httNTQ30P6 (F17W) (■) or httNTQ3 (F17W) (Δ). The emission maximum of monomeric peptide (•) is plotted as being equivalent to that of initial aggregates, since this is the result obtained for the F17W mutant of the shorter, less rapidly aggregating httNTQ20P10. The httNT aggregation reaction was carried out to 800 hrs, at which time W17 remained completely solvent exposed (not shown). (B) Time course monitored by HPLC sedimentation assay (——◆——), R2=0.983, S.E.= ±6.0), thioflavin T fluorescence (——Δ——, R2=0.994, S.D.= ±3.9) and right angle light scattering (---○---, R2=0.983, S.D.= ±6.0). Inset, first 10 hrs. (C) Dot blots of httNTQ30P6 (F17W) time points using the antibody MW1. Top row: unfractionated aliquots of the reaction mixture (time in hrs; M = non-incubated monomer). Bottom row: equivalent masses of isolated aggregates (no material in the “M” column in this row).
Figure 8
Figure 8
Time course of aggregation of httNTQ20P10 by multiple analyses. (A) Trypsin sensitivity of either monomer (t = 0) or aggregates isolated by centrifugation at either 42 or 700 hours (see Methods). (B) Properties of isolated aggregates: fluorescence emission maxima of Trp residues in the mutant peptides F11W (——•——, R2=0.994, S.D.= ±0.5) and F17W (····▲····, R2=0.916, S.D.= ±1.2); elongation rate constants for biotinyl-Q29 for isolated aggregates adherent to microtiter plate wells (---□---, R2=0.748, S.D.= ±0.19). (C) Overall aggregation kinetics of WT peptide monitored by the HPLC sedimentation assay (---◆---, R2=0.992, S.D.= ±3.1) and by ThT fluorescence (——Δ——, R2=0.974, S.D.= ±6.0). (D) Dot blot of non-incubated monomer (M) and isolated aggregates developed with to the anti-polyQ MW1 antibody. (E) Fourier transform infrared (FTIR) spectra of aggregates. Monomeric Q15 (a); aggregates of httNTQ20P10 (F17W) isolated at 45 hrs (b), 120 hrs (c), and 120 days (d); aggregates of httNTQ36P10 isolated at 7 days (e); aggregates of Q30 isolated at 30 days (f). Amide I frequency values normally assigned to secondary structural features and Gln side chains are shown with bars at the top of the panel.
Figure 8
Figure 8
Time course of aggregation of httNTQ20P10 by multiple analyses. (A) Trypsin sensitivity of either monomer (t = 0) or aggregates isolated by centrifugation at either 42 or 700 hours (see Methods). (B) Properties of isolated aggregates: fluorescence emission maxima of Trp residues in the mutant peptides F11W (——•——, R2=0.994, S.D.= ±0.5) and F17W (····▲····, R2=0.916, S.D.= ±1.2); elongation rate constants for biotinyl-Q29 for isolated aggregates adherent to microtiter plate wells (---□---, R2=0.748, S.D.= ±0.19). (C) Overall aggregation kinetics of WT peptide monitored by the HPLC sedimentation assay (---◆---, R2=0.992, S.D.= ±3.1) and by ThT fluorescence (——Δ——, R2=0.974, S.D.= ±6.0). (D) Dot blot of non-incubated monomer (M) and isolated aggregates developed with to the anti-polyQ MW1 antibody. (E) Fourier transform infrared (FTIR) spectra of aggregates. Monomeric Q15 (a); aggregates of httNTQ20P10 (F17W) isolated at 45 hrs (b), 120 hrs (c), and 120 days (d); aggregates of httNTQ36P10 isolated at 7 days (e); aggregates of Q30 isolated at 30 days (f). Amide I frequency values normally assigned to secondary structural features and Gln side chains are shown with bars at the top of the panel.
Figure 9
Figure 9
Mechanism of httNT mediated exon1 aggregation. The httNT domain (green) unfolds in a polyQ repeat length dependent fashion and, once unfolded, self-aggregates without a nucleation barrier to form oligomers with cores comprised of httNT and not polyQ (red). The next identified aggregates involve both httNT and polyQ in amyloid-like structure, while oligo Pro (black) is not incorporated into the core. This drawing is schematic and is not meant to imply any details of aggregate structure, except that final aggregates are rich in β-sheet, are fibrillar, and involve both httNT and polyQ. Although the initial formation of oligomers exhibits non-nucleated, downhill kinetics, it is likely that a nucleation event takes place stochastically within the oligomer population – as shown in brackets - to trigger rapid amyloid growth.

References

    1. Bates GP, Benn C. The polyglutamine diseases. In: Bates GP, Harper PS, Jones L, editors. Huntington's Disease. Oxford University Press; Oxford, U.K.: 2002. pp. 429–472.
    1. Bates GP, Harper PS, Jones L, editors. Huntington's Disease. Oxford University Press; Oxford, U.K.: 2002.
    1. Wetzel R. Misfolding and aggregation in Huntington's disease and other expanded polyglutamine repeat diseases. In: Dobson CM, Kelly JW, Ramirez-Alvarado M, editors. Protein Misfolding Diseases: Current and Emerging Principles and Therapies. Wiley; New York: 2009. in press.
    1. Arrasate M, Mitra S, Schweitzer ES, Segal MR, Finkbeiner S. Inclusion body formation reduces levels of mutant huntingtin and the risk of neuronal death. Nature. 2004;431:805–10. - PubMed
    1. Chen S, Ferrone F, Wetzel R. Huntington's Disease age-of-onset linked to polyglutamine aggregation nucleation. Proc. Natl. Acad. Sci. USA. 2002;99:11884–11889. - PMC - PubMed

Publication types

MeSH terms