. 2009;4(3):e4739.
doi: 10.1371/journal.pone.0004739. Epub 2009 Mar 9.

Hypoxia alters cell cycle regulatory protein expression and induces premature maturation of oligodendrocyte precursor cells

Affiliations

Hypoxia alters cell cycle regulatory protein expression and induces premature maturation of oligodendrocyte precursor cells

Ravi Shankar Akundi et al. PLoS One. 2009.

Abstract

Background: Periventricular white matter injury (PWMI) is a common form of brain injury sustained by preterm infants. A major factor that predisposes to PWMI is hypoxia. Because oligodendrocytes (OLs) are responsible for myelination of axons, abnormal OL development or function may affect brain myelination. At present our understanding of the influences of hypoxia on OL development is limited. To examine isolated effects of hypoxia on OLs, we examined the influences of hypoxia on OL development in vitro.

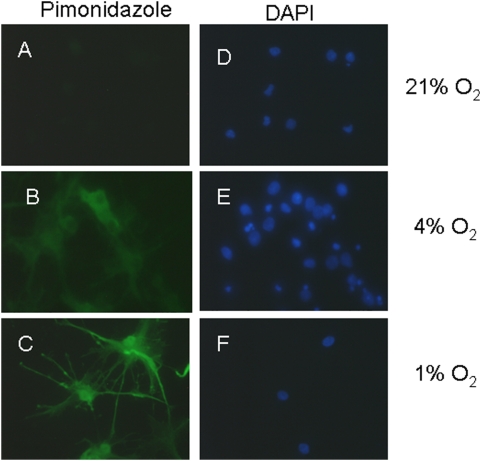
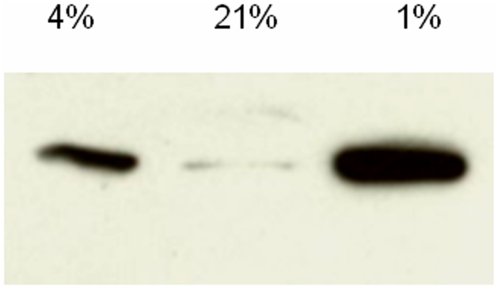
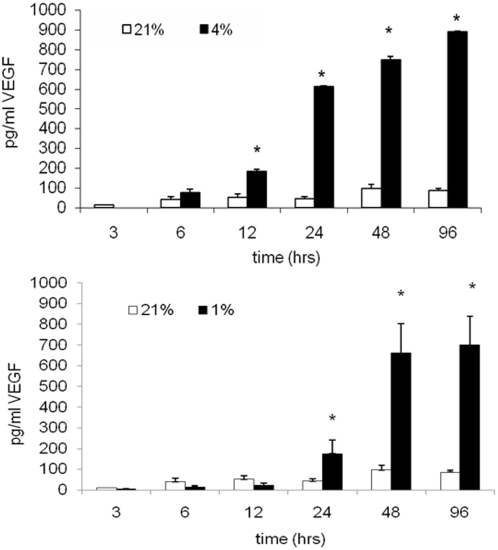
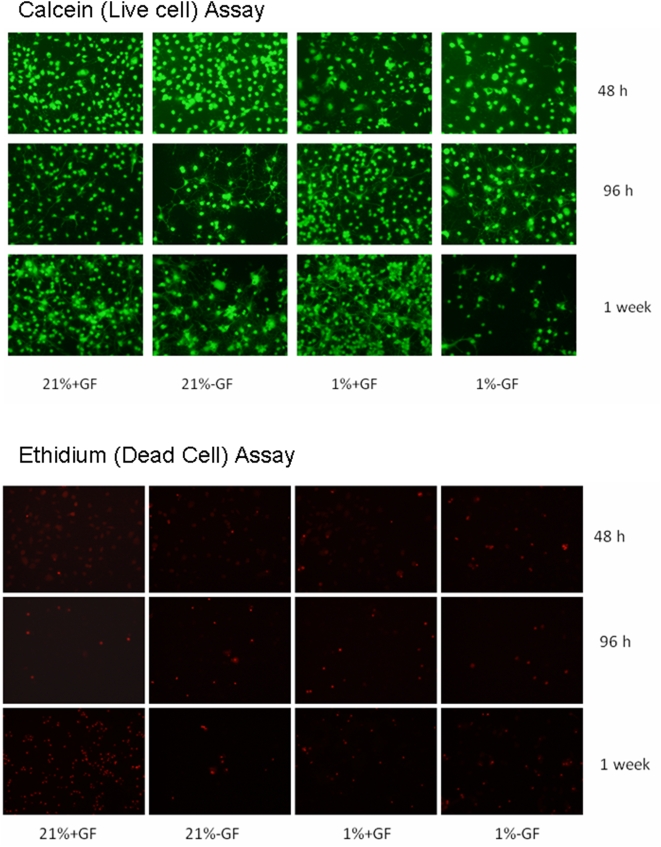
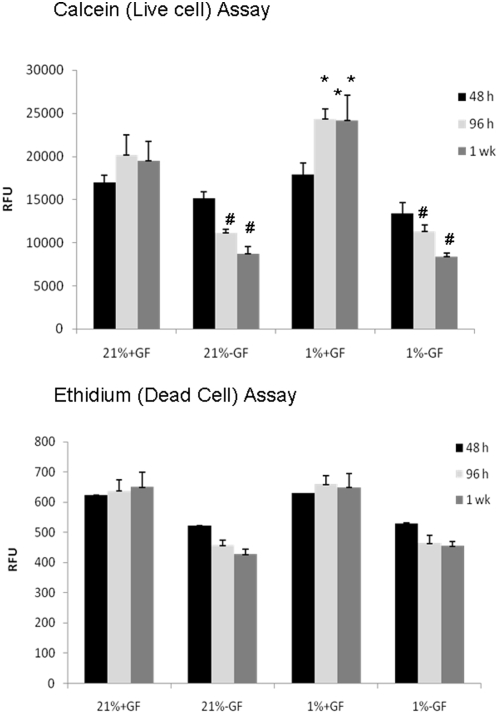
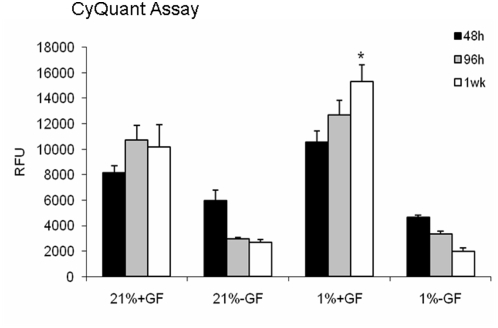
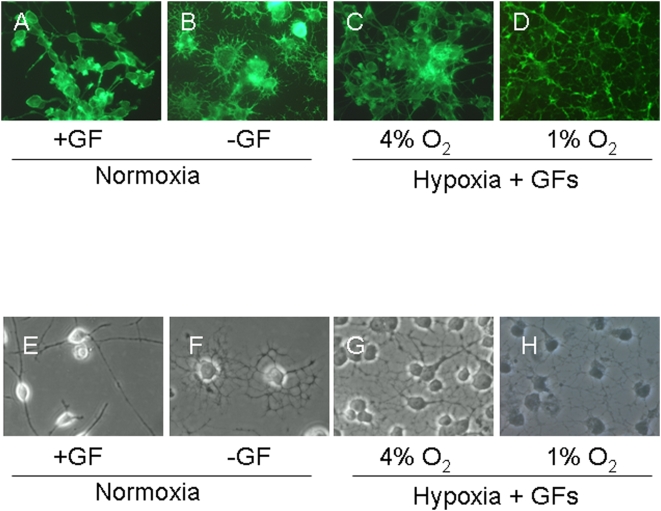
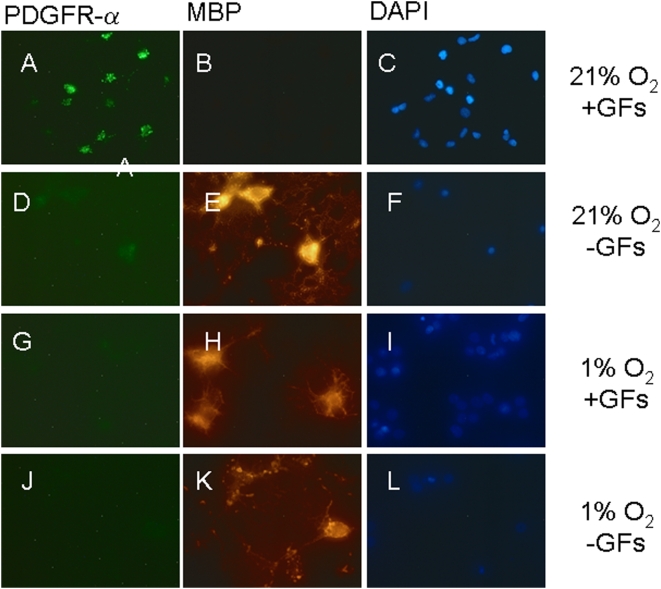
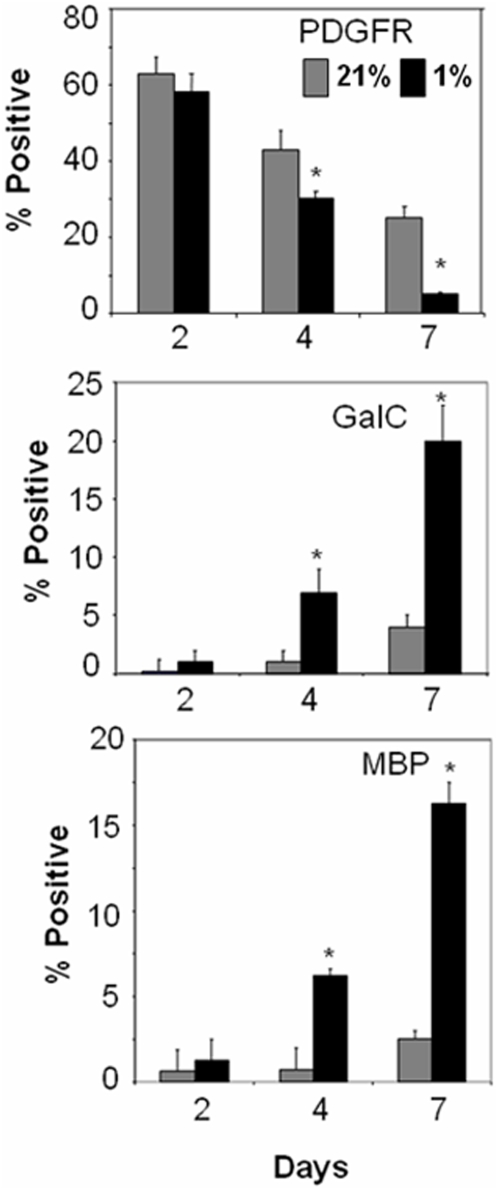
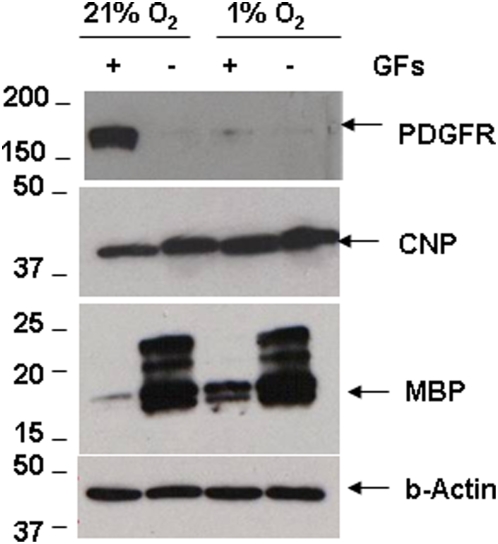
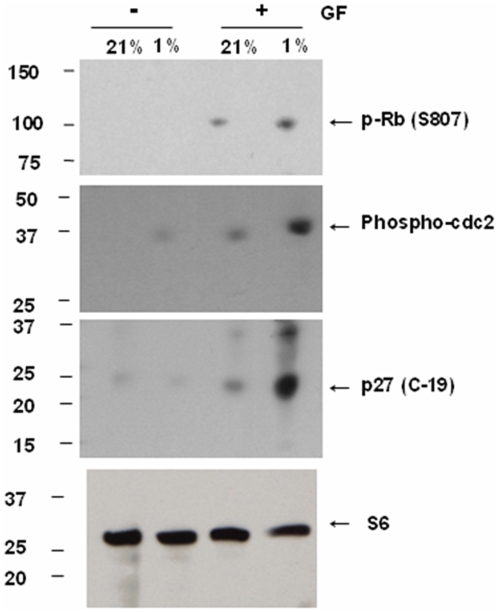
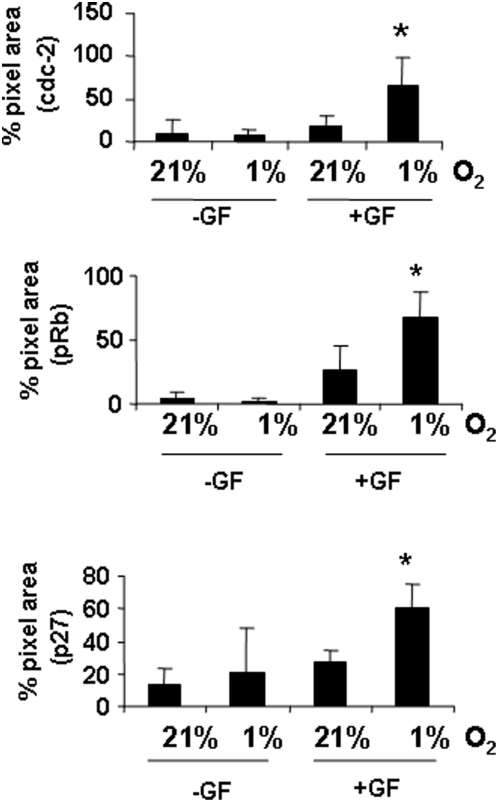
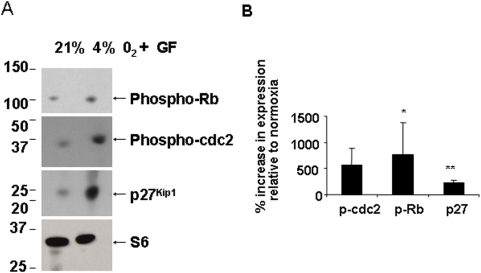
Methodology/findings: Cultures of oligodendrocyte precursor cells (OPCs) were prepared from mixed glial cultures and were 99% pure. OPCs were maintained at 21% O(2) or hypoxia (1% or 4% O(2)) for up to 7 days. We observed that 1% O(2) lead to an increase in the proportion of myelin basic protein (MBP)-positive OLs after 1 week in culture, and a decrease in the proportion of platelet-derived growth factor receptor alpha (PDGFRalpha)-positive cells suggesting premature OL maturation. Increased expression of the cell cycle regulatory proteins p27(Kip1) and phospho-cdc2, which play a role in OL differentiation, was seen as well.

Conclusions: These results show that hypoxia interferes with the normal process of OL differentiation by inducing premature OPC maturation.


Conflict of interest statement

Competing Interests: The authors have declared that no competing interests exist.

Figures

Figure 1
Figure 1. Demonstration of intracellular hypoxia.
Intracellular hypoxia was assessed by incubating cells with pimonidazole (A, C and E), which forms adducts at pO2 of <10 mm Hg (green). Cells are counterstained with DAPI (B, D, and F; blue). Note absent staining in 21% O2 (A), moderate staining in 4% O2 (C), and high level staining in 1% O2 (E). Scale bars = 10 um. Data shown are representative of four separate studies.
Figure 2
Figure 2. Hypoxia influences on Hif-1α.
Whole cell lysates of OLs cultured in 21%, 4% or 1% O2 for 6 hrs. Cell lysates were immunoblotted for Hif-1α (120 kDa). 50 ug of protein per lane. Data shown are representative of three such studies.
Figure 3
Figure 3. Hypoxia influences on VEGF A.
OLs were cultured in the presence of GFs in 21%2, 4% or 1% O2. Cell culture media was collected at 48 hrs, 96 hrs, and 7 days and levels of secreted VEGF A were measured by ELISA (*p<0.01; ANOVA vs. 21% O2). Data shown are representative of three separate studies.
Figure 4
Figure 4. Hypoxia influences on cell viability.
Images of calcein (live) and ethidium (dead) cells labeled OLs cultured in the presence or absence of GFs in 21%2, 4% or 1% O2 for 48 hrs, 96 hrs, and 7 days. Images shown are representative of 4 separate studies.
Figure 5
Figure 5. Hypoxia influences on cell viability.
Calcein (live) and ethidium (dead) assays of OLs cultured in the presence or absence of GFs in 21%2, 4% or 1% O2 for 48 hrs, 96 hrs, and 7 days. Relative florescence units are shown (RFU). Data are averages of 4 separate studies. (*p<0.01; ANOVA vs. 21% O2+GF; #, P<0.05 ANOVA vs. 21% O2+GF).
Figure 6
Figure 6. Hypoxia influences on cell number.
CyQuant analysis was performed at 48 hrs, 96 hrs, and at 7 days for OLs cultured in the presence or absence of GFs in 21%2 or 1% O2. Relative florescence units are shown (RFU). In GF-treated cultures in 1% O2, levels was similar to the 21% O2 group at 46 and 96 hours (p>0.05; ANOVA). At 7 days, levels were greatest in the cells cultures in 1% O2 and GFs (*, p<0.05; ANOVA). Data are averages of three separate studies.
Figure 7
Figure 7. Changes in OL morphology in hypoxia.
OLs were cultured in 21% O2 in the presence of GFs (A, E), in the absence of GFs (B, F), or under with GFs in 4% O2 (C, G) or 1% O2 (D, H) for 1 week. Fluorescence images of cells stained with actin-specific phalloidin (A–D) and phase-contrast images (E–H) of OLs show that cultures deprived of GFs (B, F) or cultures exposed to hypoxia (C, D, G, H) undergo morphological changes consistent with enhanced maturation. Scale bars = 10 um. Data shown are representative of five separate studies. At least ten separate coverslips were analyzed per study.
Figure 8
Figure 8. Hypoxia induces premature OL maturation.
Images of OLs cultured for one week in 21% O2 in the presence (A–C) or absence (D–F) of GFs, or in 1% O2 with (G–I) or without (J–L) GFs. Cells were double-labeled for PDGFRα (A, D, G, J) or MBP (B, E, H, K) and counterstained with DAPI (C, F, I, L). A higher proportion of cells stained for PDGFRα (green) in 21% O2 whereas more MBP (red) labeled cells were observed in 1% O2 plus GF, or in GF-deprived cultures. OL differentiation was assessed from numbers of MBP-positive cells relative to total cell number (DAPI-positive nuclei). (* p<0.001 in comparison to cultures treated with GFs and maintained at 21% O2). Scale bars = 10 µm. Data shown are representative of three separate studies. At least ten separate coverslips were analyzed per study.
Figure 9
Figure 9. Hypoxia induces premature OL maturation.
Percentages of cells that are positive for PDGFRα, GalC, or MBP cultured in 21% or 1% O2 plus GFs at 48 hrs, 96 hrs or 7 days in culture. * p<0.05 1% vs. 21% O2 at each time. Data shown are representative of three separate studies. At least three separate coverslips were analyzed per study.
Figure 10
Figure 10. Hypoxia mediated acceleration of OL maturation.
Cell lysates of OLs in 21% and 1% O2 for 1 week with GFs were analyzed by immunoblotting. Representative image shows decreased PDGFRα and increased MBP expression in 1% O2, and in cultures without GFs. β-actin loading control shown in bottom panel.
Figure 11
Figure 11. Changes in OL cell cycle proteins in 1% O2.
Whole cell lysates from OLs cultured at 21% O2 or 1% O2 in the presence or absence of GFs, were analyzed by immunoblot analysis for phosphorylation state of cell cycle proteins Rb and cdc2, and for the negative regulator of cell cycle, p27Kip1. Ribosomal S6 protein was used as a loading control. The approximate sizes for Rb, cdc-2, p27Kip1 and ribosomal S6 protein are 110 kDa, 34 kDa, 27 kDa and 32 kDa, respectively. Representative Western blot from 3 different preparations shows an increase in phosphorylated forms of Rb and cdc-2, and total p27Kip1 levels in hypoxia. Data shown are representative of three separate studies.
Figure 12
Figure 12. Changes in OL cell cycle proteins in 1% O2.
Densitometric analysis of data in Figure 9 was done by normalizing protein levels to ribosomal S6 protein levels. The percent increase in the expression of cell cycle proteins is shown relative to levels in 21% O2 (* p<0.05, ** p<0.01). Data shown are representative of three separate studies.
Figure 13
Figure 13. Changes in OL cell cycle proteins in 4% O2.
Whole cell lysates from OLs cultured at 21% O2 or 4% O2 in the presence of GFs, were analyzed by immunoblot analysis for phosphorylation state of cell cycle proteins Rb and cdc2, and for the negative regulator of cell cycle, p27Kip1. Ribosomal S6 protein was used as a loading control. The approximate sizes for Rb, cdc-2, p27Kip1 and ribosomal S6 protein are 110 kDa, 34 kDa, 27 kDa and 32 kDa, respectively. Representative Western blot from 3 different preparations shows an increase in phosphorylated forms of Rb and cdc-2, and total p27Kip1 levels in hypoxia. (B) Densitometric analysis was done by normalizing protein levels to ribosomal S6 protein levels. The percent increase in the expression of cell cycle proteins is shown relative to levels in 21% O2 (* p<0.05, ** p<0.01). Data shown are representative of three separate studies.

References

    1. Rezaie P, Dean A. Periventricular leukomalacia, inflammation and white matter lesions within the developing nervous system. Neuropathology. 2002;22:106–132. - PubMed
    1. Ment LR, Schwartz M, Makuch RW, Stewart WB. Association of chronic sublethal hypoxia with ventriculomegaly in the developing rat brain. Brain ResearchDevelopmentalBrain Research. 1998;111:197–203. - PubMed
    1. Back SA, Volpe JJ. Cellular and molecular pathogenesis of periventricular white matter injury. MRDD Res Rev. 1997;3:96–107.
    1. Back SA. Approaches to the cellular and molecular pathogenesis of human perinatal white matter injury. In: Choi D, Dacey R Jr, Hsu CH, Powers W, editors. Cerebrovascular disease: Momentum at the end of the second millenium (21st Princeton Conference) Armonk, New York: Futura Press; 2001. pp. 131–160.
    1. Pfeiffer SE, Warrington AE, Bansal R. The oligodendrocyte and its many cellular processes. Trends Cell Biol. 1993;3:191–197. - PubMed

Publication types