

A genome wide survey of SNP variation reveals the genetic structure of sheep breeds
- PMID: 19270757
- PMCID: PMC2652362
- DOI: 10.1371/journal.pone.0004668
A genome wide survey of SNP variation reveals the genetic structure of sheep breeds
Abstract
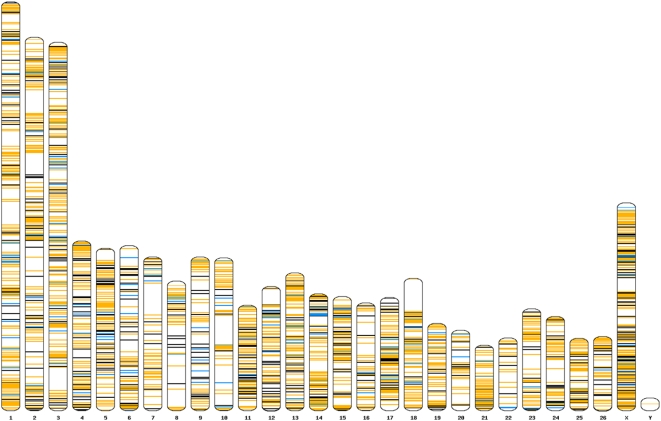
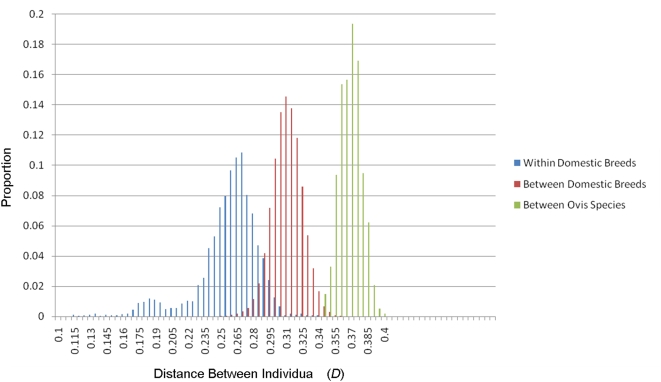
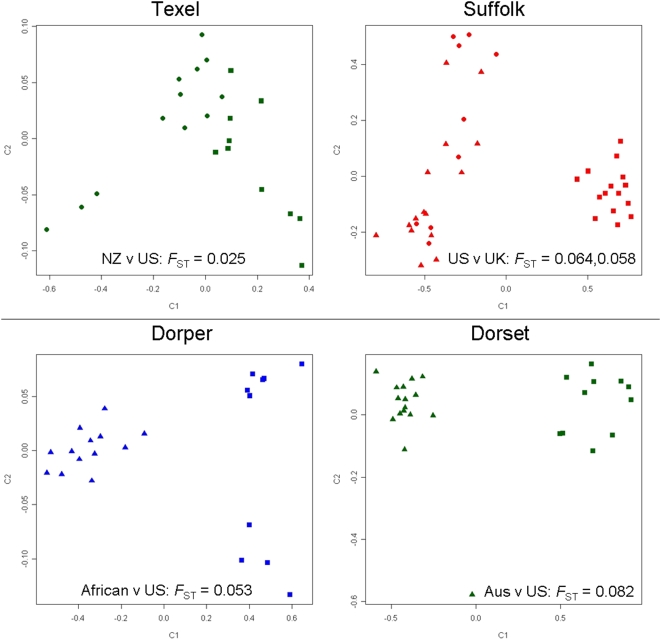
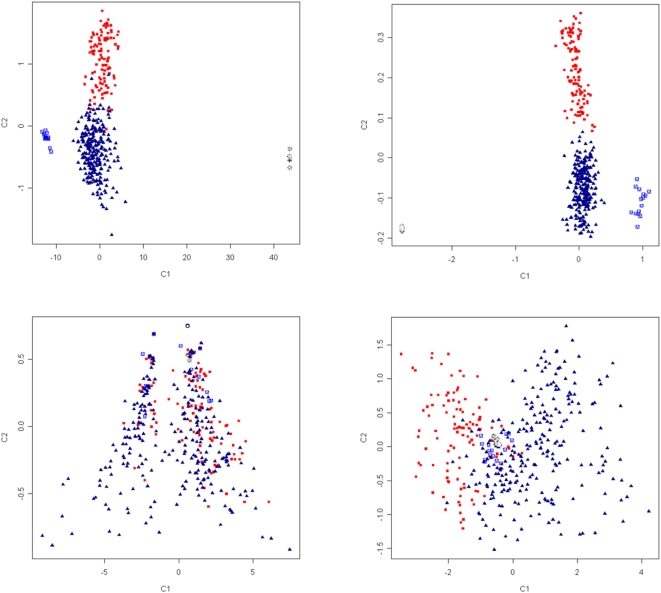
The genetic structure of sheep reflects their domestication and subsequent formation into discrete breeds. Understanding genetic structure is essential for achieving genetic improvement through genome-wide association studies, genomic selection and the dissection of quantitative traits. After identifying the first genome-wide set of SNP for sheep, we report on levels of genetic variability both within and between a diverse sample of ovine populations. Then, using cluster analysis and the partitioning of genetic variation, we demonstrate sheep are characterised by weak phylogeographic structure, overlapping genetic similarity and generally low differentiation which is consistent with their short evolutionary history. The degree of population substructure was, however, sufficient to cluster individuals based on geographic origin and known breed history. Specifically, African and Asian populations clustered separately from breeds of European origin sampled from Australia, New Zealand, Europe and North America. Furthermore, we demonstrate the presence of stratification within some, but not all, ovine breeds. The results emphasize that careful documentation of genetic structure will be an essential prerequisite when mapping the genetic basis of complex traits. Furthermore, the identification of a subset of SNP able to assign individuals into broad groupings demonstrates even a small panel of markers may be suitable for applications such as traceability.
Conflict of interest statement
Figures
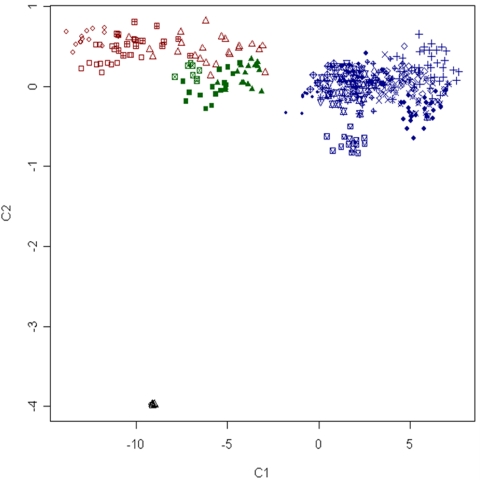
 ), Merino (
 ), Poll_Dorset (
 ), Rambouillet (
 ), Red Masai (
 ), Romney (
 ), Soay (
 ), Sumatran Thin Tail (▪) , Texel (
 ) , Tibetan (▴), Finsheep (♦), Katahdin (
 ), Romanov (
 ), Namaqua Afrikaner (x̂), Ronderib Afrikaner (□), Composite (⋄), Bighorn (▵) and Thinhorn (x̂).
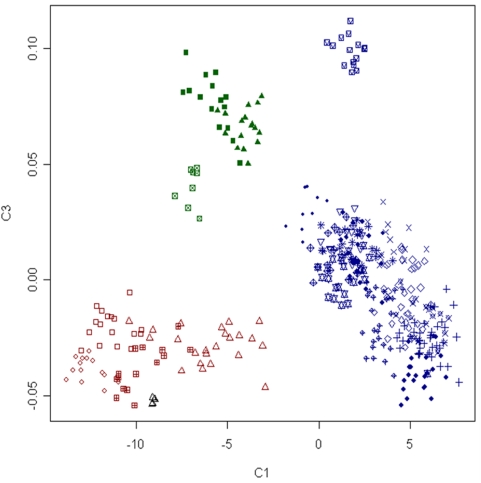
 ), Merino (
 ), Poll_Dorset (
 ), Rambouillet (
 ), Red Masai (
 ), Romney (
 ), Soay (
 ), Sumatran Thin Tail (▪) , Texel (•) , Tibetan (▴), Finsheep (♦), Katahdin (•), Romanov (•), Namaqua Afrikaner (x̂), Ronderib Afrikaner (□), Composite (⋄), Bighorn (▵) and Thinhorn (x̂).
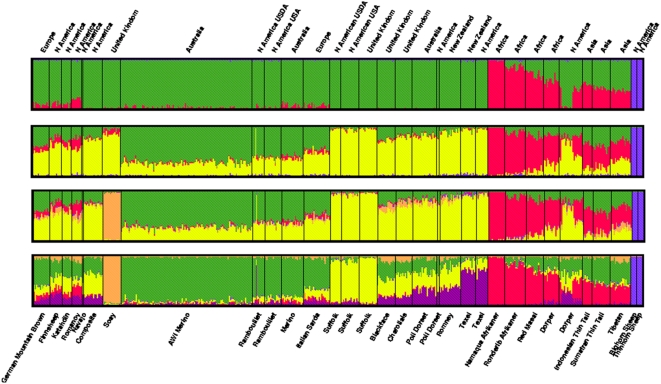
References
-
- Legge T. The beginnings of caprine domestication, In: Harris DR, editor. The Origins and Spread of Agriculture and Pastoralism in Eurasia. New York: Smithsonian Institution Press; 1996. pp. 238–262.
-
- Scherf DB, editor. World Watch List for Domestic Animal Diversity, Ed. 3. Rome: Food and Agriculture Organization of the United Nations; 2000.
-
- Wood NJ, Phua SH. Variation in the control region sequence of the sheep mitochondrial genome. Anim Genet. 1996;27:25–33. - PubMed
Publication types
MeSH terms
Substances
LinkOut - more resources
Full Text Sources
Other Literature Sources
